Case study
-
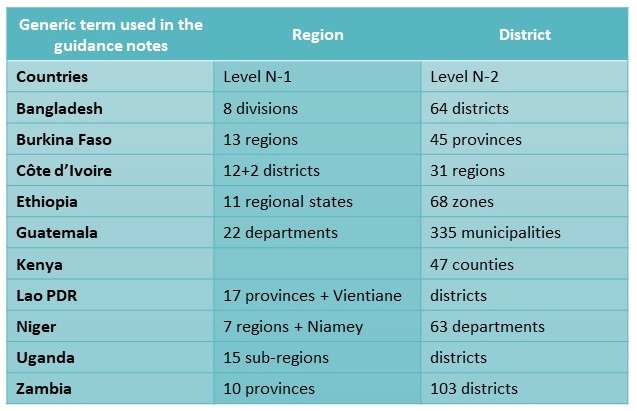
What do we mean by “Sub-National” divisions in NIPN countries?
Administrative sub-divisions differ across countries. For the purpose of this tool the following definitions are adopted:
- The generic term “Region” is equivalent to the “Sub-National Administrative Level N-1”, which typically splits the country into 10-20 sub-divisions.
- The generic term “District” is equivalent to the “Sub-National Level N-2”, which typically splits the country into 30-100 sub-divisions.
“Region” is used as a generic term in the tool for “Sub-National Level 1”. The notable exception is Côte d’Ivoire where “Region” actually refers to “District”.
Sub-national divisions in NIPN countries ***** -
The SUN MEAL national and sub-national dashboards
National dashboards have been produced for the SUN countries. Sub-national dashboards are currently being produced, which are slightly different and designed to compare data across districts.
Main features of the SUN MEAL dashboard:
- Clear sub-sections that correspond directly to the SUN Theory of Change and also align in many respects with the UNICEF and Lancet nutrition frameworks.
- Indicators with “no data” appear clearly (although not shown in this example).
- Most recent year of when the indicator was collected is included.
- Data sources are included.
- Colour coding clearly shows performance compared with median performance of other countries (or national median for sub-national dashboard).
- Sub-national dashboards that are not yet fully finalised are colour coded to compare one region with another.
- A summary narrative is included.
- A page to explain the colour classification is included.
- 6 pages in total for national dashboards; 8 pages for initial draft sub-national dashboards (not yet published).
The SUN MEAL dashboard contains the following sections:
- Enabling environment
- Finance for nutrition
- Intervention and food supply
- Enacted legislations
- SDGs drivers of nutrition
- IYCF and dietary Intake
- Nutrition status
- SDGs linked to nutrition
Example Extract of the SUN MEAL national dashboard for Lao PDR
-
The POSHAN District dashboards (India)
Link:
http://poshan.ifpri.info/category/publications/district-nutrition-profiles/Main features of the POSHAN district dashboard:
- District level dashboard
- Clear sub-sections
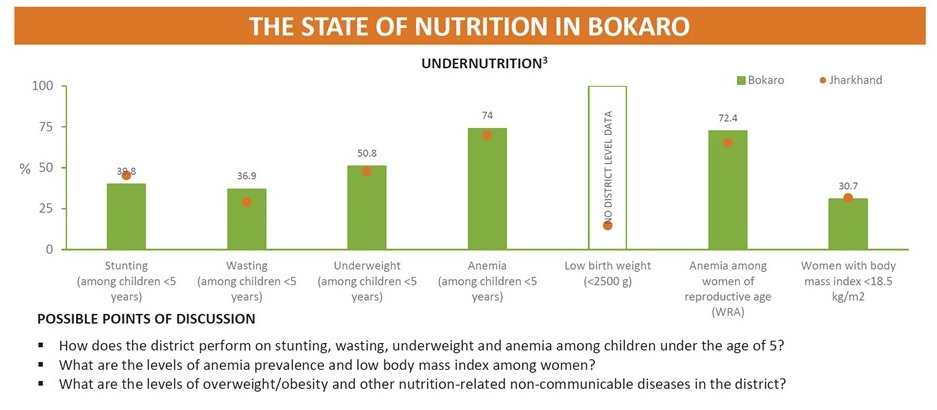
- Very clear and simple bar chart with average of the district and average of the state. One issue with this sort of bar chart is the scale as it is difficult to compare indicators ranging from 10 to 20% with those ranging from 40 to 50%.
- Indicators with “no data” appear clearly.
- Data sources are included.
- A section with “Possible points of discussion” is included.
- A page describing the determinants of malnutrition and sources of information
- 4 pages in total for sub-national dashboards
The POSHAN district dashboard contains the following sections:
- Demographic profile
- The state of nutrition
- Immediate determinants of nutrition
- Coverage of nutrition-specific interventions
- Underlying and basic determinants of nutrition
- Interventions that affect basic and underlying determinants
Example Extract from the POSHAN dashboard of the Bokaro district
-
The Global Nutrition Report national dashboards
Link:
https://globalnutritionreport.org/Main features of the GNR national dashboard:
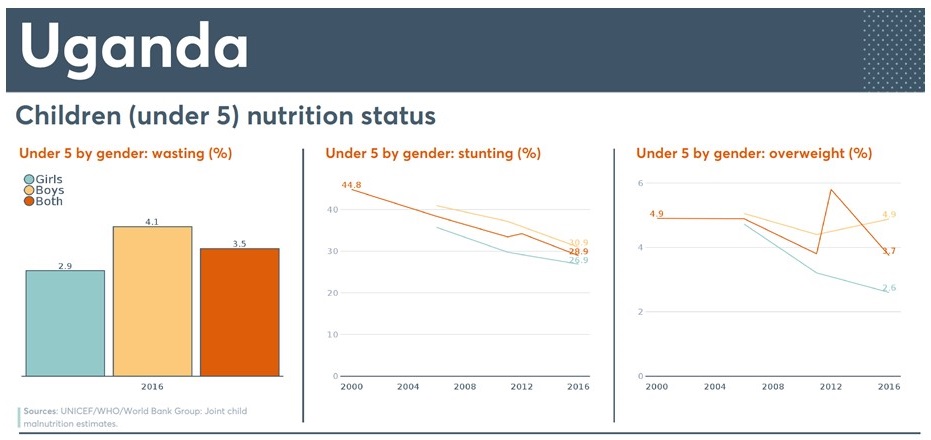
- Clear sub-sections
- Helpful visual lay out with variety of colours but quite dense
- Some graphs difficult to interpret right away
- Data sources are included
- Analysis of inequalities as defined by wealth quintile included
- Section on progress against Global Nutrition Targets included
- 2 pages in total for national dashboards
The GNR national dashboard contains the following sections:
- Economics and demography
- Child anthropometry
- Adolescent and adult nutrition status
- Progress against Global Nutrition Targets
- Intervention coverage and child feeding practices
- Underlying determinants
- Financial resources and policy, legislation and institutional arrangements
Example Extract from the GNR national dashboard of Uganda
-
Countdown 2030 maternal, new-born and child survival national profiles
Link:
http://countdown2030.org/country-and-regional-networks/country-profilesMain features of the Countdown 2030 national profiles:
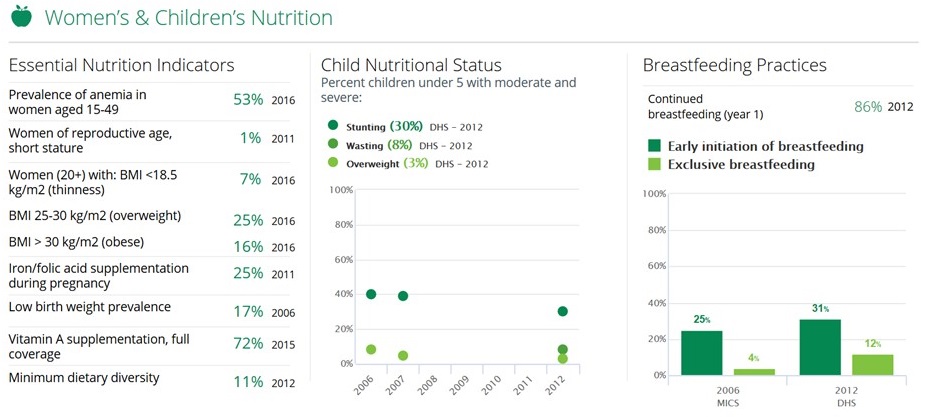
- Clear sub-sections
- Helpful visual lay out with variety of colours but quite dense
- Interactive web-based profile with a lot of potential
- Equity plots that are quite easy to interpret are included
- Data sources are included through a link
The Countdown 2030 national profile contains the following sections:
- Demographics
- Continuum of care coverage
- Equity
- Maternal & newborn health
- Women’s and children’s nutrition
- Child health
- Policies, system, financing
- Environmental
Example Extract from the Countdown 2030 national profile of the Republic of Côte d’Ivoire
-
Nutrition Landscape Information System (WHO NLiS) country profiles
Link:
http://apps.who.int/nutrition/landscape/report.aspxMain features of the WHO NiLS country profiles:
- Clear sub-sections
- Year of when the indicator was collected is included
- Direct link to source of information (good for web readers, less good for readers of printed dashboards)
- Very clear information on the meaning and interpretation of each indicator (click window)
- Section on policies and programmes listed in the GINA database included
The WHO NiLS country profiles contain the following sections:
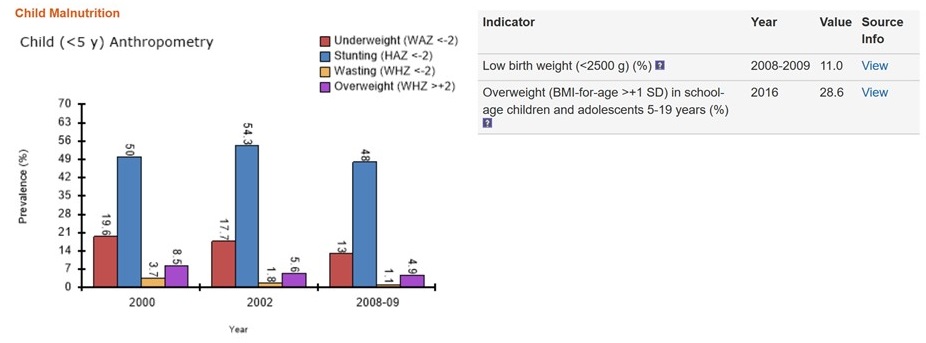
- Child malnutrition
- Malnutrition in women
- Vitamin and mineral deficiencies
- Health services
- Food security
- Caring practices
- Commitment
- Capacity
- Meta indicators
- Policies and actions in the Global Database on the Implementation of Nutrition Action (GINA)
Example Extract from the WHO NiLS country profile of Guatemala
-
Information system, dataset, indicator
An information system is a system of interrelated components that work together for collecting, processing, storing and disseminating information amongst stakeholders/beneficiaries to support decision-making, coordination, control, analysis and visualisation (e.g. DHIS-2; National Statistics Office repository; DHS platform).
A dataset is a file that contains all the individual records of one specific survey (e.g. DHS survey in country “X” of 2005). A dataset can be available in one or more information systems. For example, the Niger DHS survey of 2012 can be found in the STATcompiler information system (DHS official platform) and in the information system of the National Statistical Office of Niger.
An indicator is calculated based on one or more variables from a dataset.
The same indicator can be found in different datasets but may or may not be comparable because:- The definition of the indicator is not exactly the same. For example, the definition of some indicators of DHS surveys have evolved over time.
- The survey sampling methodology is different.
-
Two options to overcome challenge n°1
Option 1: Limit the exercise to the level of the datasets (exclude the indicator matrix)
The exercise is still vast and the scope of the exercise can be further reduced by considering the following:
1) The range of datasets to investigate
For example, Côte d’Ivoire decided to investigate the datasets managed by key sectors involved in nutrition (health, education, gender, social affairs, agriculture, animal resources, water, economy, finance & planning) and other agencies known for managing databases (National Agency for Rural Development, National Water Offices, etc.)
“Key sectors” are those involved in the Multi-sectoral Plan of Action for Nutrition. In some countries this list can be much more vast, including more than ten ministries. For the sake of the data landscape exercise, it is recommended to reduce the list of data providers to investigate to keep the exercise feasible. Other sectors could be investigated in a second stage using the experience of the first exercise.2) The level of detail of information to collect for each dataset
NIPN teams can decide the level of detail necessary to collect for each dataset. One option is to request a detailed description of datasets only for some prioritised sectors.Option 2: Include datasets and indicator matrix in the data landscape exercise
The scope of the data landscape exercise can be reduced by looking at:
1) The number and range of indicators to investigate
There are several ways to decide the number and range of indicators to include in the matrix:- Select key data providers instead of selecting indicators. For example, the Côte d’Ivoire NIPN country team decided to investigate all the data available in key ministries (health, education, gender, social affairs, agriculture, animal resources, water, economy, finance & planning) and other agencies known for managing databases (National Agency for Rural Development, National Water Offices, etc.)
- Refer to the M&E plan and list of multi-sectoral indicators that are attached to a national multi-sectoral plan of action for nutrition. If this list is still too long, key indicators can be identified and selected. For example, the Guatemala NIPN country team selected 70 key indicators from the M&E plan. This would mean that the indicators matrix is limited to those 70 indicators but the description of the datasets would need to have a wider scope.
- Adapt the SUN MEAL system which includes a list of multisectoral indicators (about 300) and a sub-selection of key indicators (about 70) for nutrition.
2) The level of detail of information to collect for each indicator
There are several options to consider when deciding the level of detail for each indicator, which include:- Complete a full indicator matrix. The indicator matrix available here is an example of an in-depth assessment for each selected indicator.
- Compile only basic information for each indicator. For example, the NIPN in Burkina Faso listed all the indicators available in the datasets and their definition only.
- Complete the indicator matrix in full for key sectors only (Health, Agriculture, Education, etc.) and collate less detailed information for the sectors that are of lower priority. For example, the NIPN in Ethiopia decided to focus on nutrition & WASH in the first phase. This means that a detailed indicator matrix can be completed for these two domains with less detailed information for the other domains.
-
The National Evaluation Platform (NEP) project
The Nutrition Evaluation Platforms is an initiative of Johns Hopkins University in four African countries (Mali, Malawi, Mozambique and Tanzania) that was supported by the Government of Canada between 2014 and 2018.
Its objective is to equip government decision makers with the tools and skills needed to critically evaluate the state of maternal, newborn, and child health and nutrition in their countries, and support sound decision making. It is built through a cycle-based approach that progressively adds new types of data, analytical tools and communications skills, and disseminates findings to policy makers concerned with maternal and child health and nutrition.
NEP has been implementing a country-owned and government-led approach. It works with multiple national stakeholders concerned with maternal and child health, nutrition data and decision making, who all have an interest in improving health and nutrition and decreasing mortality outcomes.
To consult the NEP country experience, or to review the outputs generated and lessons learnt, you can consult the NEP website. -
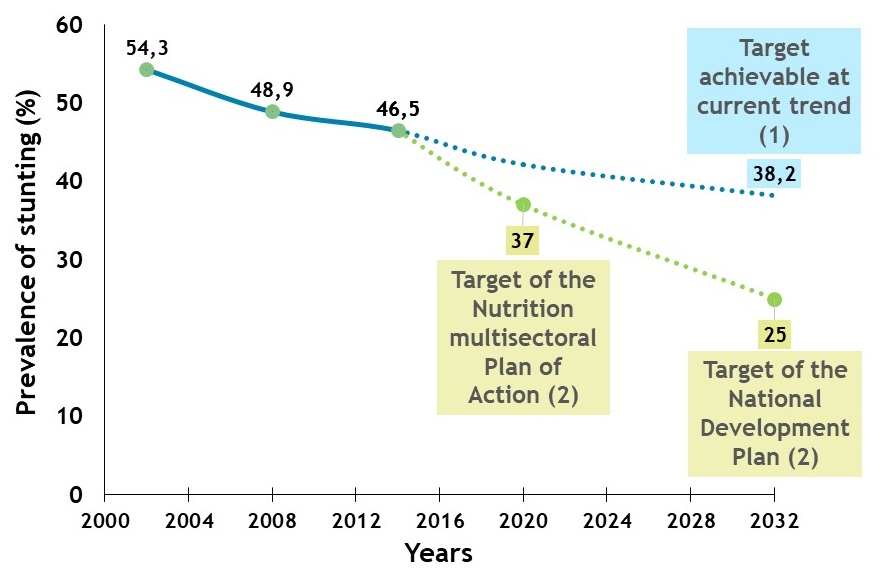
EXERCISE 1: Understand the magnitude and the current trend of the undernutrition indicator and the required trend for meeting national or sub-national targets
Work with the data analysts to draw a picture of the magnitude and trends of the undernutrition indicators: it is recommended that DHS and any other prevalence point from validated national surveys are used.
Draw two scenarios:- continuation of the current trend,
- trend required to meet the national target.
This exercise is to be carried out or repeated at the sub-national level (region, district) in which the NIPN is strategically interested. If data allow to do so, the NIPN cycle should support decentralised or sub-national decision-making as much as possible, and thus identify the relevant priority questions corresponding to that level.
-
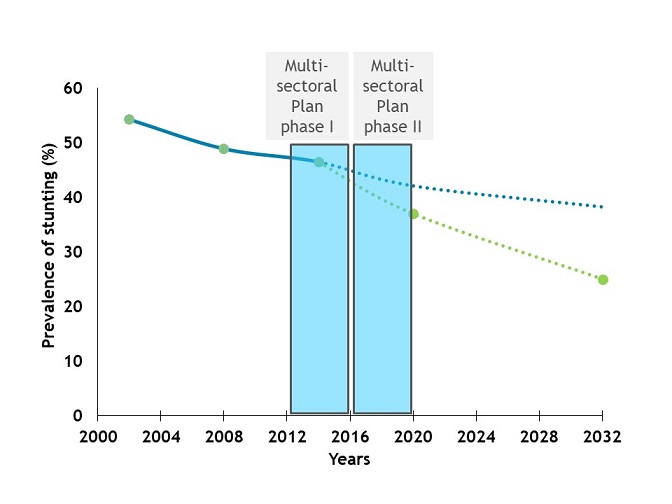
EXERCISE 2: Map out key multisectoral policies and plans of action in relation to the undernutrition trend
Prepare a visual presentation of the main multisectoral policies and plans in relation to the undernutrition trend and consider how the trend has evolved during the implementation period.
Do the same for those policies, programmes and/or changes in investment in nutrition that are believed to have been most relevant in previous years.
The priorities and interests of stakeholders will differ depending on the stage of the policy or plan:
- At formulation stage, the focus will be on the definition of targets, the selection of interventions, the required coverage, etc.
- During implementation, the priorities will be around progress of implementation and probability of reaching targets.
- At evaluation, the focus will be on impact: what worked, what did not.
Each stage represents a strategic opportunity to improve the next one if the corresponding information and evidence would be available to decision makers.
The assumption is that if the multisectoral policy, plan or programme is well designed, and if the interventions are implemented 1) according to planned coverage and 2) with the desired quality, an impact on the intended outcome should be seen.
Visualising the implementation period of the policy, plan or programme in relation to the undernutrition trend provides an initial idea of the probability of these assumptions being correct. -
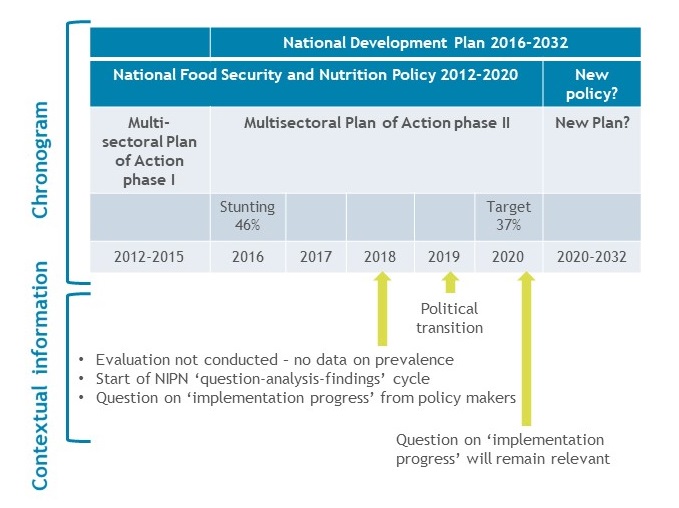
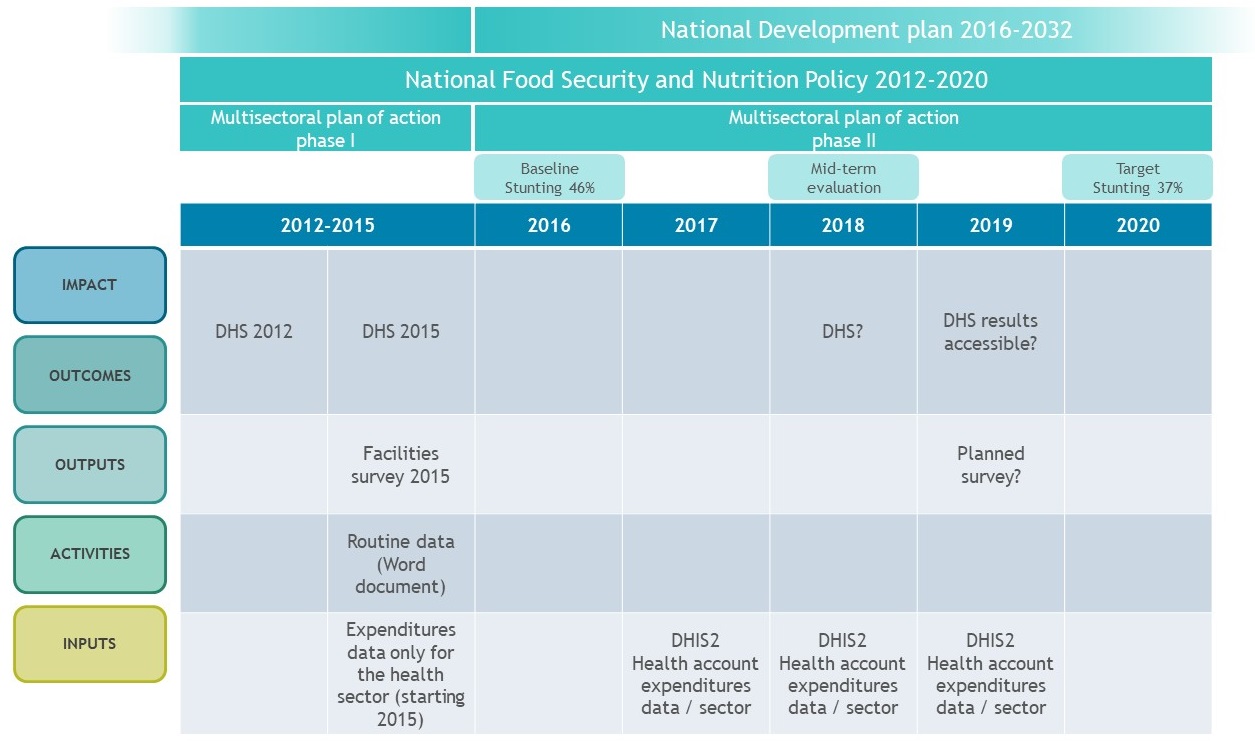
EXERCISE 3: Create a timeline for the multisectoral policies and plans
- Display the implementation periods of the multisectoral policies, plans and programmes on one timeline.
- Add complementary information on the context of implementation, as shown in the fictional country example below.
This timeline can help to confirm the priorities of policy makers for the next 12-24 months and will help to identify possible windows of opportunity for influencing planning, formulation or evaluation cycles.
The fictional example below shows that policy makers in this country needed information in 2018 about the progress of implementation of the Multisectoral Plan of Action, phase II, and the probability of achieving the targets by 2020. The absence of a mid-term evaluation made this information need, to be filled by NIPN, more acute.
With an upcoming political transition in 2019, the new policy makers also needed information regarding ‘implementation progress’ to inform the formulation of new policy by 2020.NOTE: The relationship between multisectoral and sectoral policies or plans can be presented visually in a similar way, to identify whether the latter offer an entry point to strategically support multisectoral efforts.
-
EXERCISE 4: Identify which policies, programmes or investment decisions are more likely to be influenced and decide which administrative level to influence
Ultimately, the review process will give the NIPN team an initial idea of the decision makers’ priorities and the corresponding time frame on which the ‘questions-analysis-findings’ cycle should focus.
The initial selection of the priorities will be based on the information pulled together in the policy review, using the previous tips, and on the feedback from stakeholders.
At the same time, the team will need to decide at which administrative level the NIPN cycle is able or intends to strengthen the decision-making process. This will depend on the level of decentralisation of governance, the interests of policy makers at that level and the availability of data at sub-national level. The demand for information is likely to be higher at sub-national level, where capacity to use collected data is often sub-optimal and a feedback loop is often lacking. The sub-national dashboard can support analysis at the decentralised level as long as the process is initiated by decision makers’ interests and question formulation (see section 3.5).
-
EXERCISE 5: Identify and know the key ‘decision makers’ at the various administrative levels
At this stage, the team should have good knowledge of the various decision makers along the implementation chain. Focal points working in the respective sectors can help the NIPN team to identify them.
Decision makers are not necessarily limited to policy makers: programme planners and implementation officers are other actors along the implementation chain who are also making decisions to improve nutrition actions at their level.
Categorising the decisions makers, according to the administrative level at which they intervene and according to the type of decisions they can make, will help to assess the diversity of the NIPN stakeholders’ needs.
A further stakeholder mapping exercise will help to define the target audiences, the policy relevance of the questions to them, their level of interest and level of influence in the specific nutrition policy questions. This is important in order to fine-tune and align the ‘storyline’ of the findings with each target audience of decision makers (for an example of this exercise, see section 4.1, page 3).
-
-
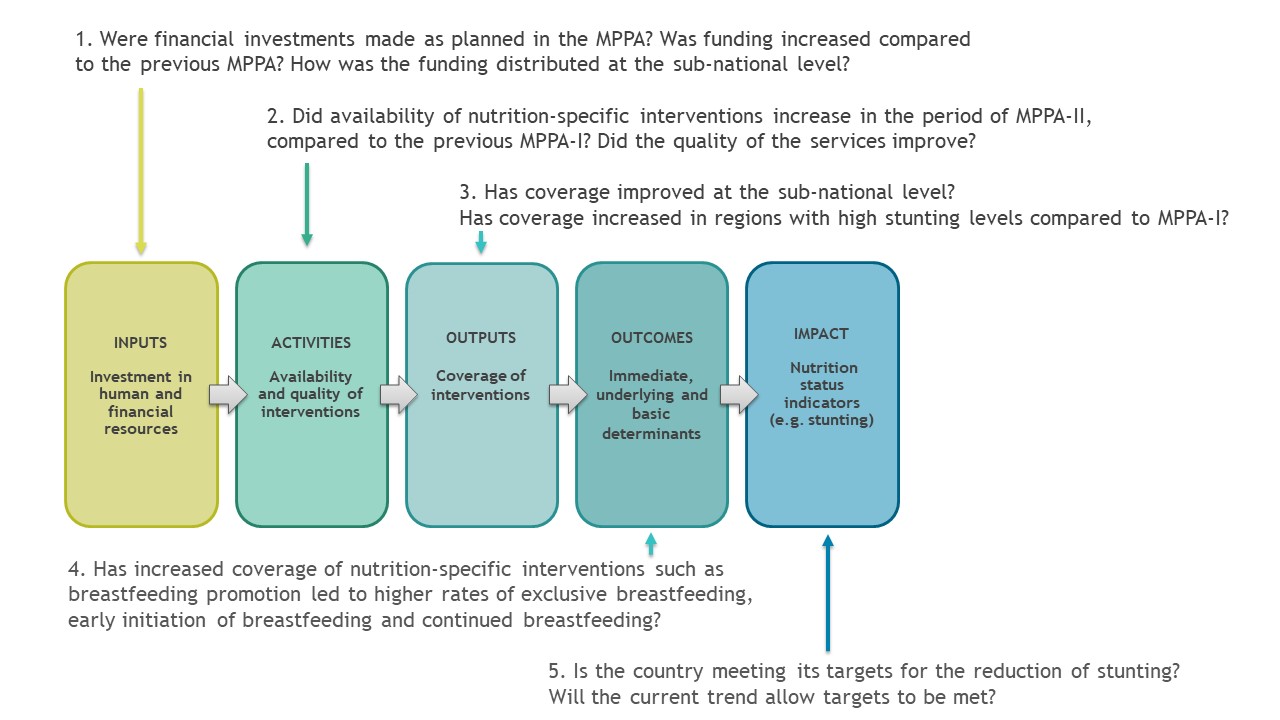
EXAMPLE 2: Identify the different elements of a specific policy question against the impact pathway and break them down into sub-questions
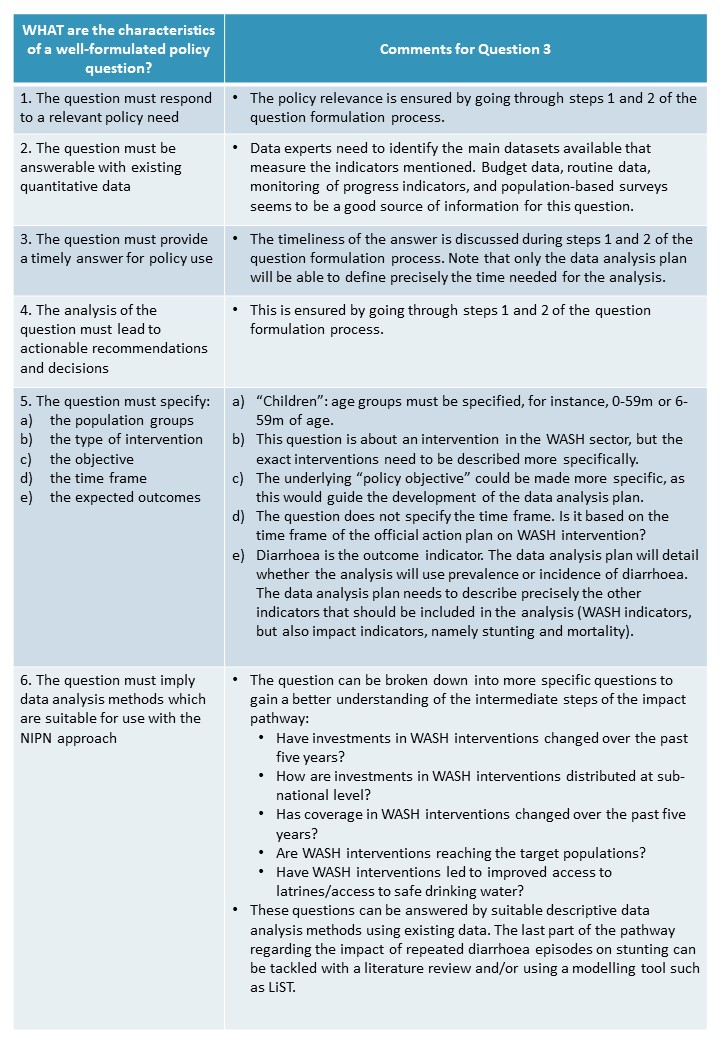
Have investments (input) in WASH interventions (activity) led to better access to WASH facilities (output), resulted in a reduction in % of children suffering from diarrhoea (outcome) and reduced child undernutrition (impact)?
1. Break the question down into more specific questions to better understand the intermediate steps of the impact pathway.
For example:- Have investments in WASH interventions changed over the past 5 years?
- How are investments in WASH interventions distributed at sub-national level?
- Has coverage in WASH interventions changed over the past 5 years?
- Are WASH interventions reaching the target populations?
- Have WASH interventions led to improved access to latrines/access to safe drinking water?
2. Unpack the question to identify the indicators, the relationship between the indicators and any assumptions, in order to generate more specific questions that can be answered by the data available.
For example:- Indicators can be investments or programme coverage.
- A relationship is: “WASH investment leads to increased WASH programme coverage.”
- An assumption is: “WASH investments translate directly into increased programme coverage.”
3. Zoom in on a specific question and unpack it further.
For example:- The latest assumption can in turn become a question to be unpacked into further questions: “WASH investments translate directly into increased programme coverage.”
- Have investments in WASH translated into equal budget expenditures at regional/department level for WASH interventions?
- In which WASH interventions have investments been made at regional level? What was the distribution of budgets across regions?
- Has staff been hired, trained and supervised in each region equally? Were supplies and equipment equally available in each region to achieve planned coverage?
- etc.
-
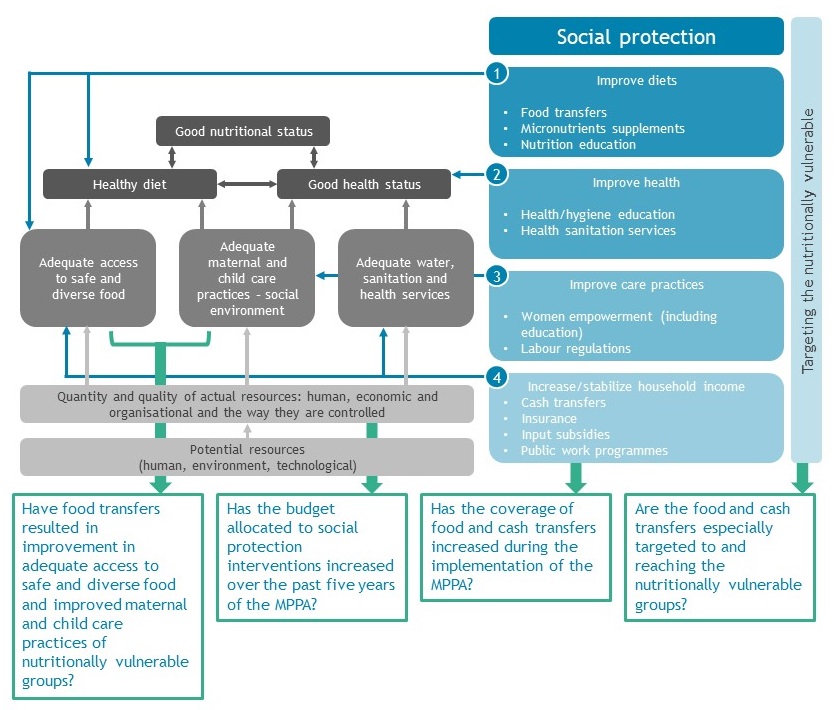
EXAMPLE 3: Formulating questions related to a social protection pathway for impact on nutrition
Based on the SUN Movement Secretariat (SMS), 2015. The contribution of agriculture and social protection to improving nutrition; Scaling Up Nutrition in Practice. Geneva.
Developing more detailed impact pathways than the ones shown in this example, which highlight specific assumptions and specific relationships between activities, outputs and inputs, will allow the formulation of more specific and detailed questions to help identify bottlenecks, such as:
- “Has the budget allocated to the implementation of social protection interventions also been used to strengthen the human resource capacity, and has this in its turn led to a higher quality of services and better targeting?”
- “What are the reasons for a lack of increase in coverage of social protection interventions? - Insufficient number of staff, low level of training, low quality of service delivery, insufficient number of distribution points, inadequate targeting, incomplete monitoring?”
-
The types of data that can be used by a NIPN
NIPN is unique in that it brings together and values multiple data sources shared by the various sectors that influence nutrition: health, agriculture, water, sanitation and hygiene, social protection, and education, among others.
Typical data that NIPN would use comes from:- National population-based surveys (which can be representative at sub-national level)
- Demographic and Health Surveys (DHS); Multiple Indicators Cluster Surveys (MICS); National Nutrition Surveys (NNS); Household Incomes and Expenditures Surveys (HIES); Health and Nutrition Expenditures Surveys (HNES); Services Availability and Readiness Assessment (SARA), etc.
- Local population-based surveys (representative of one district/region)
- Nutrition Surveys (SMART); Household surveys; Intervention coverage surveys, etc.
- Programme data
- Routine data collected by each sector
- Monitoring data collected by each sector
- Early warning system data
- Financial data
- Evaluation of budget needed (Nutrition Plan of Action)
- Official commitments for financial investments
- Budget allocation at central and sub-national levels
- Modelling data
- Global initiatives using modelling techniques provide data at national and sub-national levels: NCD Risc (http://www.ncdrisc.org/index.html) or IHME for Africa (https://vizhub.healthdata.org/lbd/cgf#).
This list is not meant to be exhaustive. Each country should explore the wealth of information available. The data landscape exercise is useful for this purpose (see section 3.1).
- National population-based surveys (which can be representative at sub-national level)
-
Example 1: Trend analysis of stunting to track progress
Using national survey data from DHS and MICS, a trend analysis can be used to estimate the Average Annual Reduction Rate of stunting (see section 3.6). The same method can be applied to other target indicators.
With this method, questions can be answered such as:- What is the current trend of stunting reduction?
- Has the reduction of stunting accelerated over the period of implementation of the last Multisectoral Plan of Action for Nutrition?
- Is the current trend in stunting reduction sufficient to reach the target?
Global average annual reduction rate for stunting (Source: EU Action Plan on Nutrition)
This analysis carried out at global level shows that the current AARR is insufficient to achieve the 2025 target. -
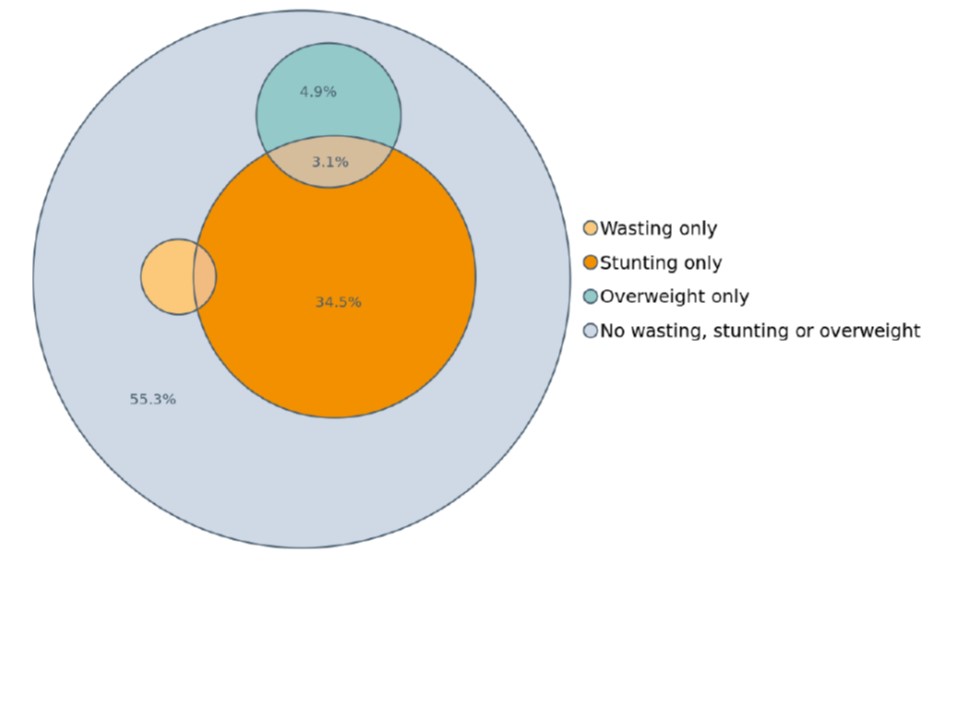
Example 2: Venn diagrams to visualise the coexistence of multiple forms of malnutrition
This Venn diagram shows the population affected by one or more forms of malnutrition.
It is taken from the Global Nutrition Report, which analysed national level data.
Similar analysis can be carried out at sub-national level to show which regions are affected by which forms of malnutrition and what actions are needed.
It allows the issue of the double burden of malnutrition to be highlighted.
The same figure with the actual number of children affected by region can highlight where to invest.Coexistence of multiple forms of malnutrition in one African country (Source: Global Nutrition Report)
-
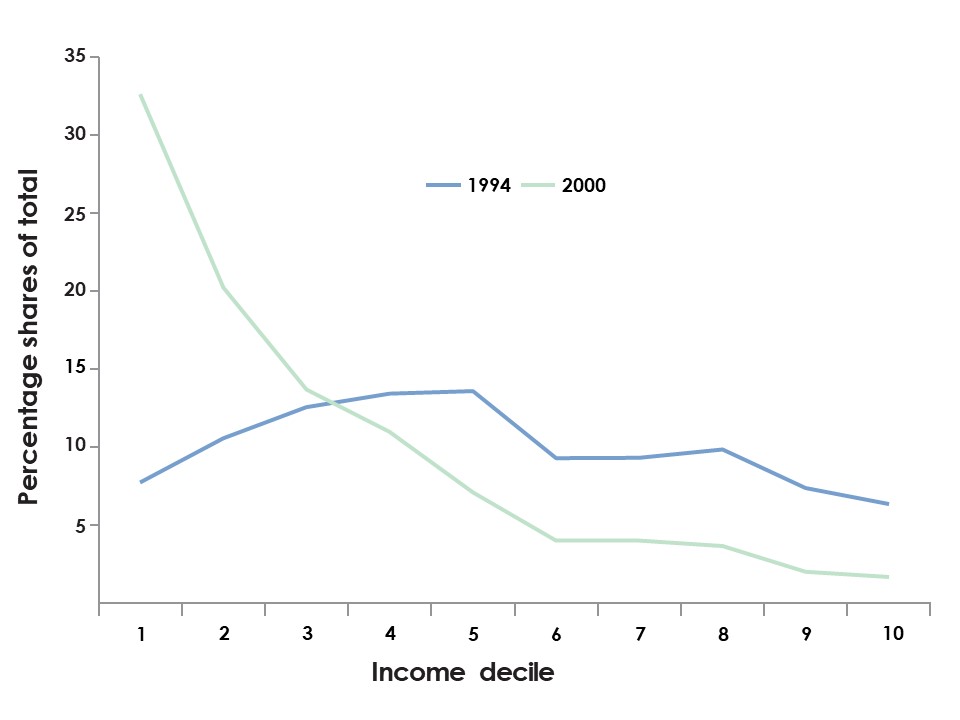
Example 3: Descriptive analysis to improve the targeting of a social assistance programme in Mexico
A National Food Assistance programme has been implemented in Mexico for decades.
In 1994, a descriptive analysis of the levels of incomes of the beneficiaries of the programme showed that the programme was not very effective at targeting the poorest households.
After active measures were taken, the same analysis showed that in 2000 a much greater proportion of the programme’s beneficiaries were indeed those with the lowest incomes.Benefit incidence of Food Oriented Social Assistance, by income decile, 1994–2000 Source: Levy, S. (2006). Progress against Poverty. Sustaining Mexico’s POP Programme. Washington, DC: Brookings Institution Press.
Between 1994 and 2000, the Government of Mexico improved the targeting of the Food Oriented Social Assistance programme:- In 1994, less than 10% of the beneficiaries belonged to the lowest income decile.
- In 2000, more than 30% of the beneficiaries belonged to the lowest income decile.
-
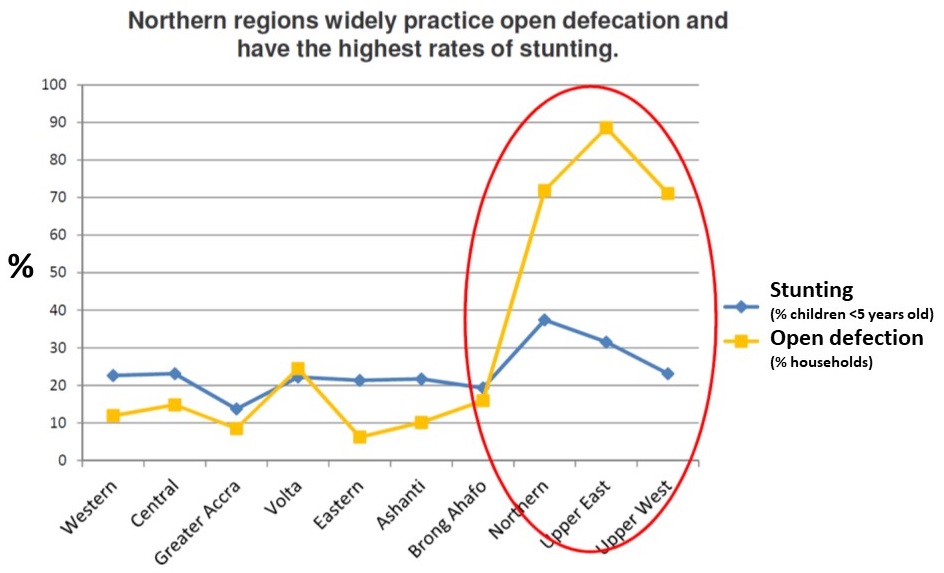
Example 4: Descriptive analysis to improve the targeting of hygiene interventions
A descriptive analysis looking at regional disparities shows that the three regions with high levels of stunting also have high levels of open defecation practices.
This can be a starting point to further investigate why open defecation is high in those three regions and whether other determinants are also showing high levels.Open defecation and stunting rates by region (Source: REACH, Example of Ghana MICS, 2011)
-
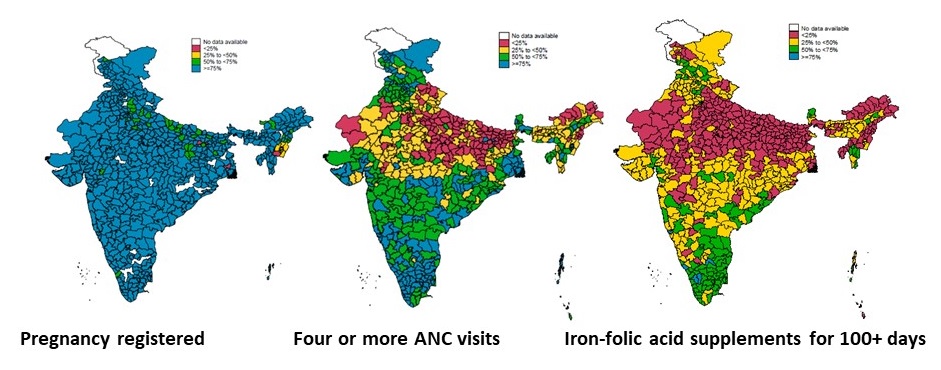
Example 5: Descriptive analysis of coverage of health interventions in India
Iron-folic acid supplements are delivered through health services. These combined data show that most districts with low levels of iron-folic acid supplements also have low ANC visits coverage, suggesting an issue with access to health services.
But the analysis also shows that quite a few districts with good ANC visits coverage also have a low coverage of iron-folic acid supplements, suggesting issues with delivery.
Further investigation is needed to provide better insights into what is needed to improve the coverage of iron-folic acid supplementation.Coverage of interventions Source: POSHAN
-
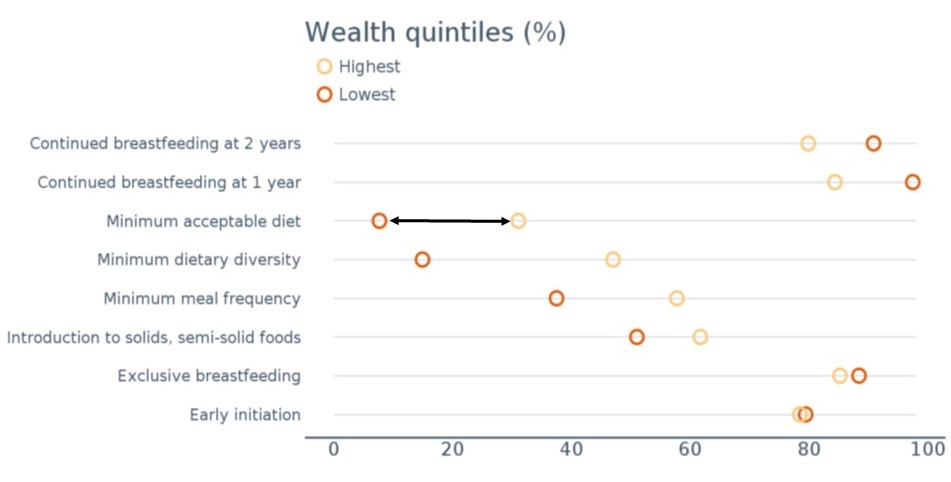
Example 6: Equity analysis of child feeding practices
This equity analysis of child feeding practices shows that some practices are more sensitive to the levels of incomes (minimum diet diversity) than others (early initiation of exclusive breastfeeding).
Equity analysis is useful to determine whether the progress achieved is benefiting all, and, in particular, the most vulnerable.
If most of the progress is only observed in households with higher incomes, this suggests that there may be a problem in the targeting or design of the interventions.Child feeding practices by Wealth Quintiles in one African country (Source: Global Nutrition Report)
-
Confounding
The characteristics of a potential confounder are as follows:
- It must be associated with the outcome;
- It must be associated with the exposure of interest;
- It must not be an intermediate step in the causal pathway between the study exposure of interest and the outcome.
Example: Has investment in programme A led to reduced anaemia levels?
Possible factors confounding a conclusion regarding the impact of one intervention on anaemia levels could be, for instance:- the coexistence of another programme with a potential impact on anaemia reduction, targeting the same population groups;
- lower malaria incidence in the intervention area due to reduced rainfall during the baseline measurement.
Without controlling the data analysis for confounding factors, it is not possible to attribute the reduction of anaemia levels to the nutrition intervention.
- While measuring an association and checking the temporality is relatively easy, controlling for all (known and unknown) confounding factors is very challenging, as data on all confounding factors is often not available in population-based surveys. This typically requires a randomised controlled trial in a research setting to measure and compare rates of anaemia and numerous potential confounding factors between the intervention group and a control group (not exposed to the intervention), before and after the intervention.
- National population-based surveys and routine monitoring data typically do not have a control group.
- Without a control group, trying to interpret an association or a causal relationship can be very misleading. There is a high risk of drawing the incorrect conclusion as in the above-mentioned example, where the conclusion was that the nutrition intervention has an impact on anaemia while in reality the change in anaemia rates were caused by a confounding factor, and not by the nutrition intervention.
Data analysis of this type of survey data is not suited for the analysis of a causal relationship and could lead to incorrect and misleading policy decisions.
-
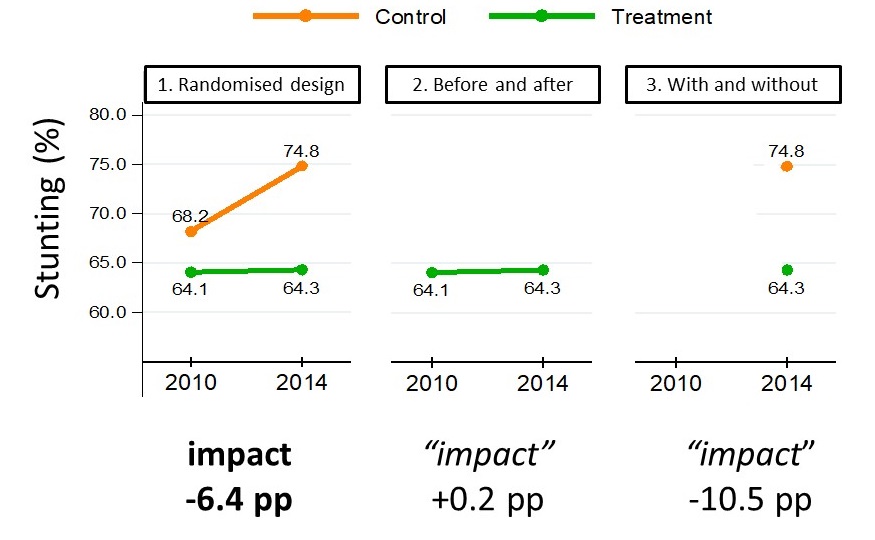
Example: Why having a control group is essential for establishing a causal relationship
This randomised controlled trial measured the impact of an intervention that was designed to reduce stunting.
Between 2010 and 2014, it was observed that:- the control group (without the intervention) saw their stunting levels increase from 68.2% to 74.8%;
- the stunting levels of the intervention group remained almost stable.
Results from secondary analysis of Tubaramure, a food-assisted integrated health and nutrition programme in Burundi
(Source: Leroy J.L., Olney D., Ruel M., 2016. Tubaramure, a Food-Assisted Integrated Health and Nutrition Program in Burundi, Increases Maternal and Child Hemoglobin Concentrations and Reduces Anemia: A Theory-Based Cluster-Randomized Controlled Intervention Trial. The Journal of Nutrition, 146(8), 1601-1608, https://doi.org/10.3945/jn.115.227462.)
- It is only by comparing the delta of pre- and post interventions for the control group and the treatment group that a robust conclusion can be reached: the intervention reduced stunting levels by 6.4 percentage points (74.8-68.2) – (64.3-64.1).
- Without a control group, the measurements “before and after intervention” for the treatment group could be compared, leading to the conclusion that the intervention had no impact (increase of 0.2 pp).
- Without baseline measurements, the populations “with and without” interventions could be compared, leading to the conclusion that the intervention had a very high impact (reduction of 10.5 pp).
In the last two cases, an incorrect conclusion has been reached.
-
Data analysis plan
1. Why a data analysis plan?
“A data analysis plan helps you think through the data you will collect, what you will use it for, and how you will analyse it. Analysis planning can be an invaluable investment of time” (Center for Disease Control and Prevention, 2013)
The method for creating a data analysis plan in the context of a NIPN is not much different from the method used in a research context.
In the context of NIPN, the process should be simpler because:- A data analysis framework is already produced (step 3 of question formulation process) and forms the basis for the more detailed data analysis plan (after step 4 of question formulation process).
- Section 3.4, pages 7 to 9 describes data analysis methodologies.
- NIPN is about the use of existing data, it is not about designing a protocol for new data to be collected.
The next section describes briefly the content of a data analysis plan focusing on what is a bit specific to the NIPN.
As general recommendations:
- Don’t panic!
- Use the advice and experiences from colleagues and experts
- Quickly contact an expert when necessary
Recommended sources to read:
Center for Disease Control and Prevention (2013) Creating an analysis plan. Atlanta.
Simpson, S.H. Creating a data analysis plan: what to consider when choosing statistics for a study (2015).2. What is a data analysis plan?
Main sections of a data analysis plan (based on CDC module):- Main question and sub-questions
- Dataset(s) to be used
- Inclusion/exclusion criteria
- Variables to be used in the main analysis
- Statistical methods and software to be used
- Table shells
=> Estimation of time and resources needed
3. Main question and sub-questions
At this stage, the policy relevant question (and, in some cases, its sub-questions) is already well defined (section 3.4, page 11).
Answering all the sub-questions will provide a full answer to the main question.4. Dataset(s) to be used
The dataset(s) needed is (are) listed. In the context of the NIPN, particular attention may be needed on data management: as the dataset(s) may come from different sources and/or may not have been designed for the main question, there could be quite some work to be done to harmonise / append / clean the raw dataset(s).- Are the datasets comparable?
- Are the indicators harmonised?
- Is there a need to transform the data for the analysis?
To answer these question, access to the datasets in question is required.
5. Inclusion/exclusion criteria
In this section population subgroups, geographic scope, timeframe… are very precisely defined.
The definition of the data quality level is also required for the analysis.
Indeed, depending on the analysis, a more or less strict data quality level could be required.
This point is detailed in the Data Quality training module (section 3.3).6. Variables to be used in the main analysis
In this section the exact variables/indicators to be used in the analysis must be defined.
For example, to analyse “obesity”, it needs to be defined whether the indicator is Body Mass Index (BMI) and if different categories of BMI will be used or the mean BMI or both.
In the context of NIPN, the harmonisation of the definition of indicators across datasets will be important.7. Statistical methods and software to be used
Ensure coherence with section 4 of the guidance notes on data analysis.
Also, to provide only indisputable analysis (principle 3 section 3.4, page 4), make sure that the statistical method used is coherent with the datasets available and the data quality of these datasets. The choice of the statistical method is key to avoid over-interpretation of the data that could lead to misleading conclusions.
Does the NIPN team has the technical capacity to handle the statistical method and the software identified?8. Table shells
Nothing specific to NIPN.9. Estimation of time and resources
At this stage, a precise estimation of the time and resources needed to conduct the analysis should be made.
If this estimation lead to more time than the initial estimation made during the data analysis framework, you may adjust the question/s to be addressed first. -
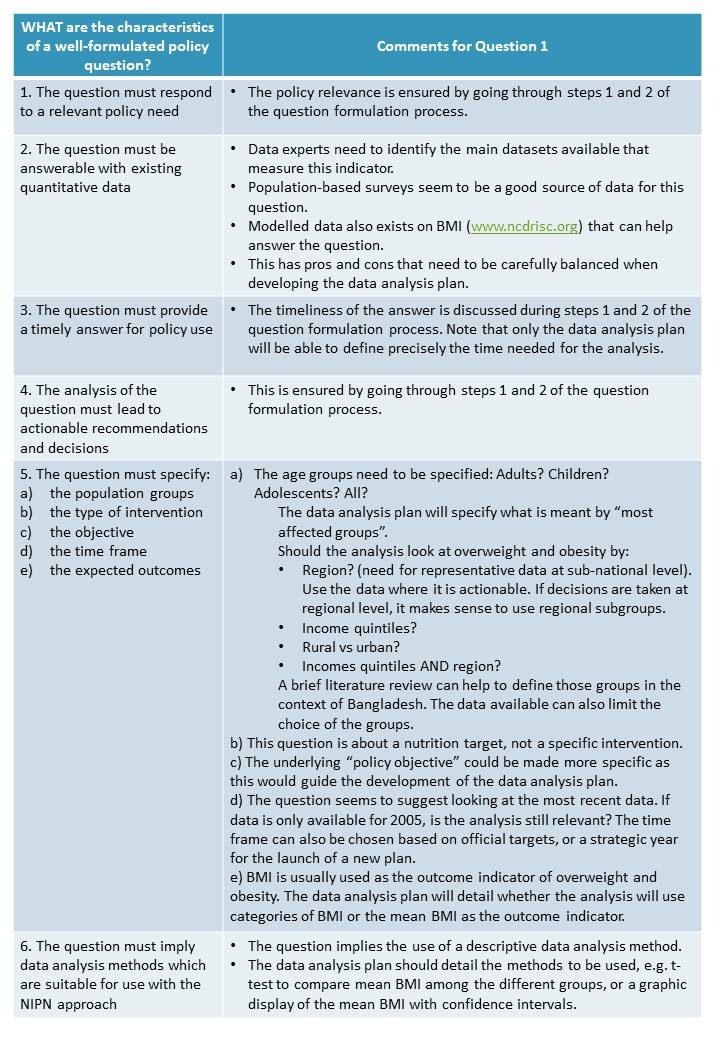
Question 1: What is the spatial distribution of obesity and overweight in Bangladesh? Who are the most affected groups?
The underlying objective behind this question is to be able to improve targeting of the intervention.
-
-
-
-
-
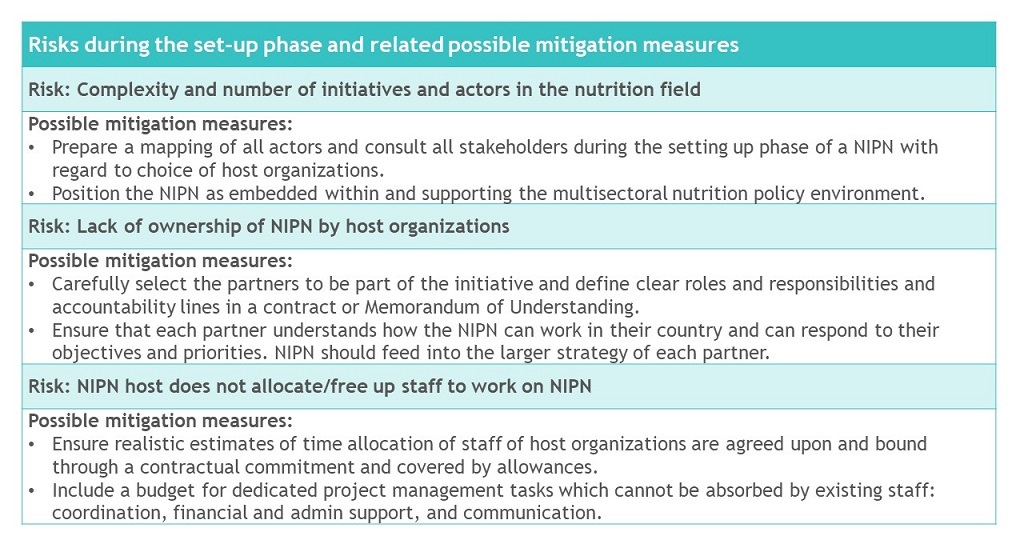
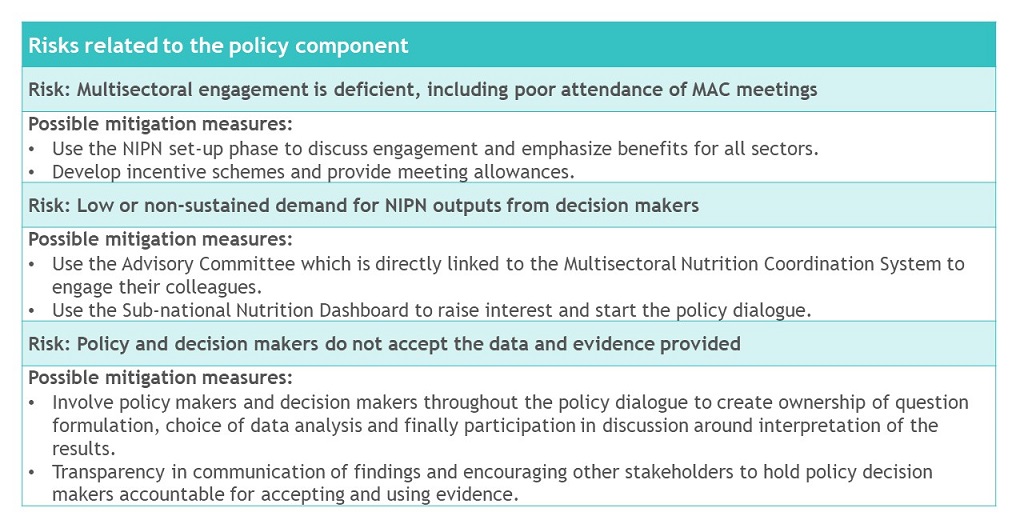
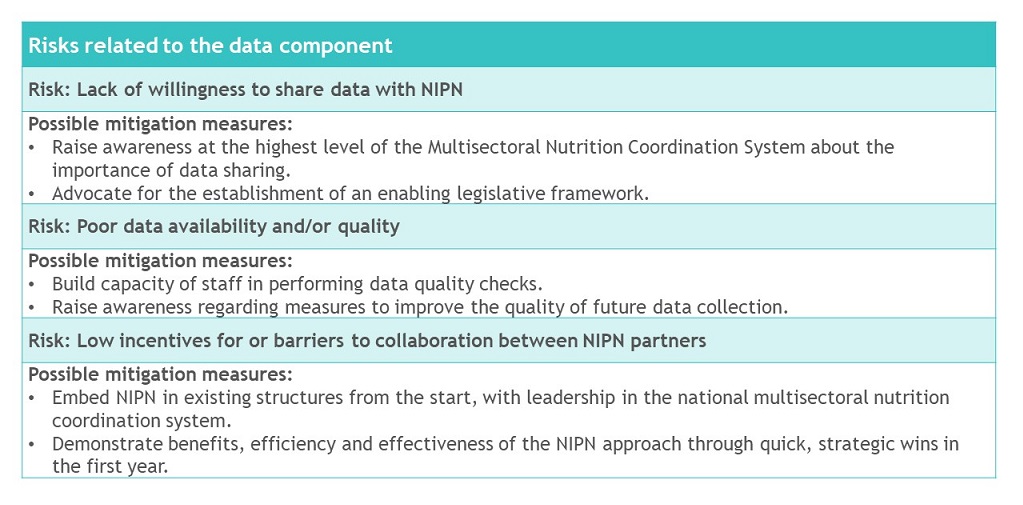
Experience of NIPN management in Guatemala
In Guatemala, a Steering Committee provides clarity and transparency on plans and arrangements to the main NIPN partners. It comprises representatives of the EU Delegation, as the main donor supporting the NIPN; the Secretariat for Food and Nutrition Security (SESAN), as the government host for the NIPN; and CATIE (Centro Agronómico Tropical de Investigación y Enseñanza), as the organisation managing the grant and providing technical assistance.
The Steering Committee meets regularly (three times a year), meetings are well attended and comprise in-depth discussions on progress, barriers to progress and how to overcome them.
CATIE has assigned an experienced coordinator, an assistant and a financial administrator to manage NIPN. The CATIE team meets weekly to discuss progress and issues and are in regular (daily) contact with the government’s NIPN host, SESAN, about project implementation.
CATIE has developed an elaborate project management tool in Excel, which tracks goals, activities and spending, with a simple traffic light system to signal progress or issues to the Project Steering Committee.
Download the Excel project monitoring template from CATIE.
***** -
Examples of documents to review
Documents that can be reviewed during the desk study include:
- Government resources such as: national policy, plans and programmes for nutrition (multisectoral and sector-specific with nutrition objectives).
- Non-governmental resources such as:
- Scaling Up Nutrition (SUN) movement UN Network online country reports and SUN country Joint Annual Assessments.
- UN Network/REACH supported documents: policy review, stakeholder and action mapping, common narrative or situation analysis overview and nutrition barometer.
- Specific NIPN policy review
-
-
Interview with the NIPN Niger team about the data landscape exercise
November 15th, 2018
- Issiak Balarabé Mahamane, Assistant to the General Secretary, INS
- Guillaume Poirel, Head of Mission for NIPN Technical Assistance, SOFRECO
Recap
The NIPN team in Niger conducted a data mapping study between November 2017 and May 2018, during the start-up phase of the project, using an external consultant. The aim of the study was to carry out “an inventory and analysis of the information and data systems for nutrition in Niger”. The study was carried out by the INS (National Statistical Office), under the strategic direction of the High Commissioner to the 3N “Nigeriens Nourish Nigeriens” initiative. This interview highlights:- How the Niger team has used the results to develop a capacity building plan for sectors
- How the Niger team dealt with the lack of official definition of key indicators for nutrition
- Methodological recommendations for collecting the information
How did the study go? What were the main challenges encountered?
The structures to investigate were identified based on the institutions named as “responsible” or “collaborative” in the eight commitments of the National Policy for Nutrition Security (PNSN).
Questionnaires were given to the sectors, resulting in a significant loss of time. The best method is to meet with the institutions directly and carry out this mapping work with them. The necessary information was obtained after just two or three visits to each institution and only the institutions at the central level were investigated. This was a limiting factor because certain information, notably on the data quality monitoring mechanism, is available at sub-national level.
Due to the sheer volume of information collected, there was an enormous amount of simplifying and restructuring work to be done by the NIPN team. The ‘sector sheets’ were systematically created, consolidating the various elements.
This led again to considerable delays: instead of being finalised by the end of December 2017, the study was finalised in May 2018 and pushed forward until February 2019.How did you use the results of the study?
Firstly, the study provided objective information about the available data from multiple sectors.
The results allowed us to draw up an initial list of indicators available in each sector in an Excel file.
The study also produced ‘Sector Sheets’ which outline:- The institutional framework;
- The organisational framework;
- The collection mechanism;
- The mechanism for the validation and quality assurance of data;
- The data management mechanism;
- The output;
- The dissemination and exploitation of information;
- The indicators and data available;
- The nutrition-sensitive indicators;
- The indicators selected for the NIPN.
Following the data mapping, it became apparent that there was an urgent need to put together a referential database of NIPN indicators. In fact, in Niger there is no existing framework providing an official list of the multi-sectoral indicators for nutrition. We are working to adopt nutrition-sensitive indicators in each sector. These indicators will serve as a basis for the NIPN platform.
Taking into account the institutions’ capacities, we decided to recruit a few ‘Sectoral Study Officers’ for four months.
The Sectoral Support Officers have access to clearly identified indicators and will have to ensure that the values for each indicator are collected (15 October 2018 – 15 February 2019), which is a necessary prerequisite for organising the data and building the ‘Nutrition Info’ module. The work of the Sectoral Support Officers will enable us to:
- Consolidate the database of nutrition indicators. As a result, for example, we have determined that in the health sector 27 nutrition indicators were missing in the initial mapping. To date, there are several stages to the consolidation: 1. Verifying the comprehensiveness of the indicators, 2) Sorting the indicators according to their link with or ‘sensitivity’ to nutrition, 3) Completing the 23 fields for each indicator (definition, frequency, method of calculation, etc.) and 4. Validating the set of fields for the indicators selected for the NIPN. Also, 239 indicators have been selected for the 3 sectors currently covered (123 indicators for health, 23 indicators for education, 93 indicators for farming and agriculture);
- Analyse the nutritional statistics situation in the beneficiary sectors;
- Create and validate data sheets for each indicator;
- Collect information and documents;
- Update the contact list.
The ‘Sectoral Study Officers’ also make it possible to strengthen capacities in each sector and build relationships that will facilitate access to multi-sectoral data at a later stage.
-
Difference between communication and visibility
Visibility of a specific organisation, project or initiative can be created by using their logo and acknowledging their contribution in the different communication events that are being organised.
For instance during a launch event of NIPN in a country, the logo of the implementing organisations and the donors should be displayed, and if available the logo of the NIPN (either the global NIPN logo or the one which has been created specifically by the country NIPN).
The NIPN countries which receive funding from the European Union are requested to develop a visibility plan following specific EU guidelines.
Communication and visibility are not the same. Communication is about specific messages that one wishes to convey, to achieve a well-defined objectives, reaching specific target audiences, using appropriate communication channels and tools. A communication plan is more elaborate, but can include a specific chapter on how it intends to create visibility for the NIPN.
Creating a specific identity and branding for the NIPN, including the design of a logo and the use of consistent templates/formats for reports and presentations, is part of the visibility plan.
-
How to do a stakeholder analysis?
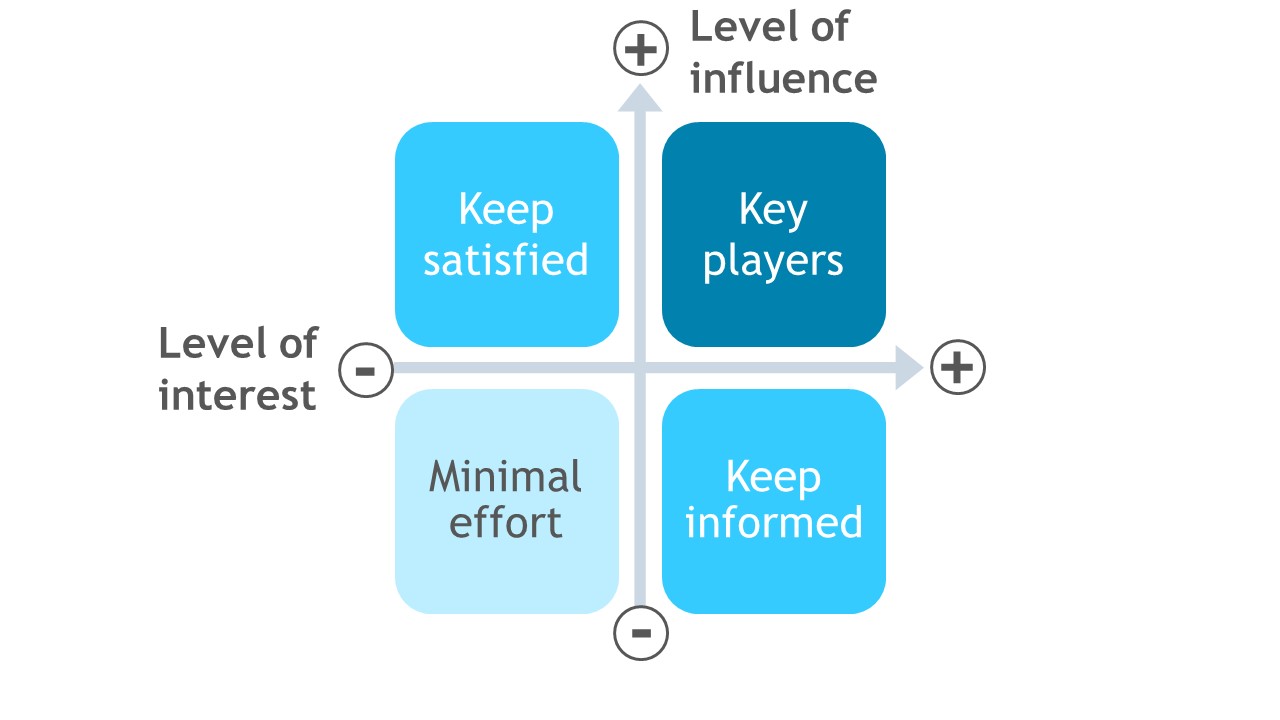
It can be very useful to do a stakeholder analysis of the overall nutrition audience to better understand which actor has which attitude towards the project and how influential that person is.
Someone who is very positive and influential could become a champion for the project in the communication approach, whereas someone who is largely negative about the project’s approach, but also influential needs to be managed carefully and communication with this person should be geared towards changing her/his attitude from negative to neutral.
If a person with a negative attitude is perceived as having very limited to no influence, less efforts need to be made to communicate with him/her.
A stakeholder mapping is usually done along 2 dimensions: the level of interest in the topic/project (negative to positive) and the level of influence or power the stakeholder has in the target community (in the case of NIPN, the multisectoral nutrition system).
Map stakeholders according to level of interest and influence -
Example 1: Using routine data to identify trends
Health routine data are usually compiled with the objective to detect epidemic episodes. In low resources settings, routine data can be incomplete and can include measurement errors. However, analysed carefully, routine data may be good enough to observe medium term trends or seasonal trends of a particular condition.
-
Example 2: National versus sub-national analyses
The NIPN may have the objective to use data from a MICS survey to study a particular region. A National Survey like a MICS has the primary objective to produce national figures. A study(1) concluded that “anthropometric data quality was highly variable both between and within survey sources and over time”. This is confirmed by interviews of experienced practitioners(2). Typically, data from a region with difficult access for logistic or security reasons can be of lower quality. The data quality of that region may be good enough to contribute to the production of a national figure but the NIPN may want to apply more stringent data quality criteria to study that region specifically.
References:- Corsi, D. J., J. M. Perkins and S. V. Subramanian (2017). Child anthropometry data quality from Demographic and Health Surveys, Multiple Indicator Cluster Surveys, and National Nutrition Surveys in the West Central Africa region: are we comparing apples and oranges? Global Health Action 10(1): 1328185.
- Interviews of 5 senior nutrition data analysts conducted by the GSF early 2019.
-
UNICEF Technical Note n°185 (2007): How to calculate Average Annual Rate of Reduction (AARR) of Underweight Prevalence
Special Note: there seem to be a missing data point in the example provided. The example to generate the AARR seems to be based on 8 data points (including 2005) while the table provides only 7 data points. When using the 7 data points, the coefficient equals -0.0669 (and not -0.06613) and AARR is still 6.4%.
-
Short history of the evolution of the parameters used to calculate AARR
- 2007: UNICEF produced the technical note n°185 to generate AARR of underweight prevalence .
- 2012: Endorsement of WHA nutrition targets for 2025.
- 2013: The European Commission developed the EU 2014-2020 Nutrition Action Plan. In collaboration with WHO, the European Commission developed an excel tool & a method for generating AARR.
- 2013: WHO modified the Excel tool using the methodology described by De Onis et al. to develop the Global Nutrition Targets Tracking Tool (de Onis, G. Dewey, Borghi, W. Onyango, Blössner, Daelmans, Piwoz and Branca. 2013. The World Health Organization’s global target for reducing childhood stunting by 2025: rationale and proposed actions).
- 2014: The Global Nutrition Report (GNR) is released including estimation of AARR using methodology described by De Onis et al. in 2013.
- 2015-2016: The GNR of 2015 and 2016 are released using different monitoring progress indicators than GNR 2014.
- 2017: The WHO and UNICEF Technical Expert Advisory Group on Nutrition (TEAM) published a key technical report recommending an updated methodology for monitoring AARR.
- 2017: The European Commission published a methodological note explaining why they maintain their initial methodology.
- 2017: The GNR 2017 is released endorsing the June 2017 TEAM recommendations.
- 2017: The WHO tracking tool v2.3 produces a technical note ensuring coherence with TEAM recommendations.
-
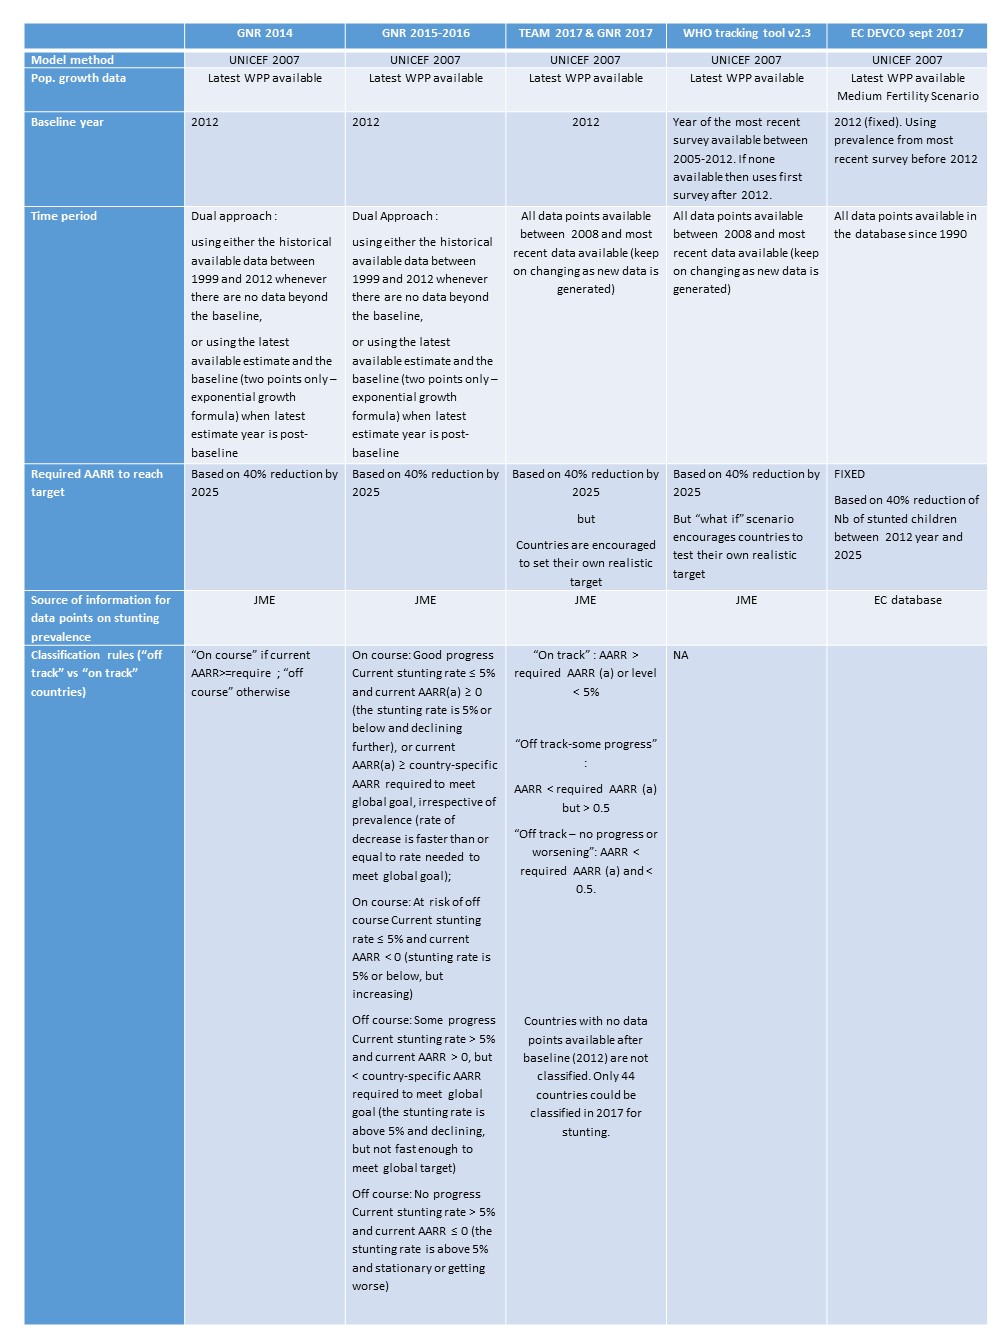
Comparison of parameters used for generating AARR by main international initiatives
The parameters of the WHO UNICEF TEAM group of 2017 are now used as the reference.
Notes:
- “WPP”: UN World Population Prospect is an accessible international database widely used for past and future demographic data at national level (data is available online by year, sex and for 5 years age-groups). The database is updated every 2 years to take into account new information from national census.
- WPP data can be different from official census data as mentioned on their website: “Official statistics are not very perfect. All data have deficiencies. Official demographic statistics are affected by incompleteness of coverage, lack of timeliness and errors in the reporting or coding of the basic information. The analysis carried out by the Population Division takes into account those deficiencies and seeks to establish past population trends by resolving the inconsistencies affecting the basic data. Use of the cohort-component method to reconstruct populations is the major tool to ensure that the population trends estimated by the Population Division are internally consistent. For more information on the methodology used by the United Nations Population Division to produce the estimates and projections for the World Population Prospects, please refer to the publication on Methodology.
- National Statistical Offices are well aware of the inconsistencies among data generated by different sources. Even in countries with advanced statistical systems, it is common for official statistical series to be revised retrospectively as new data become available and inconsistencies are corrected.”
- JME: “Joint Child Malnutrition Estimates” database of national surveys validated by countries & by WHO, UNICEF and the World Bank.
- EC database: may differ on rare occasions from JME when a survey is validated at country level but not yet uploaded on JME database or when considered unreliable by EC but validated by JME.
-
Setting up a Multisectoral Advisory Committee: a Guatemala case study
Context
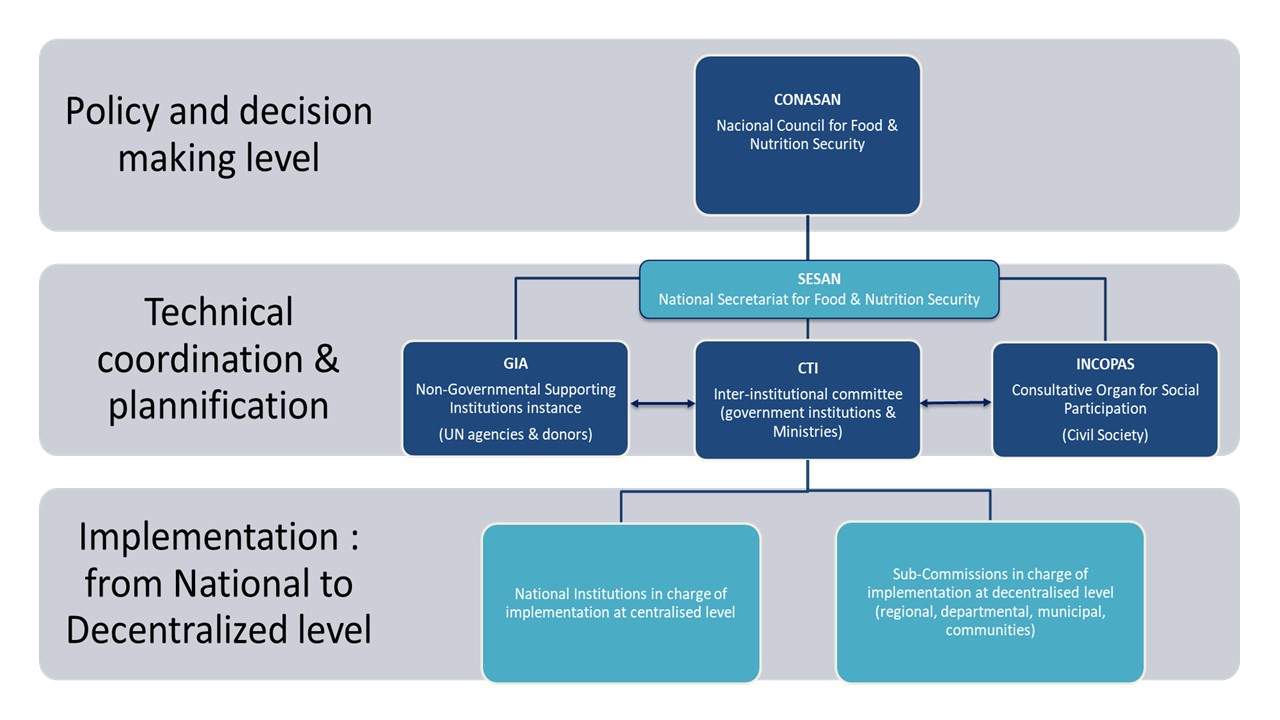
Guatemala has strengthened and institutionalised its approach to food and nutrition security through a series of legal and policy frameworks for food security and nutrition. This process began in 2005 when a law was enacted that saw the establishment of the multisectoral coordination system, the National System for Food and Nutrition Security (SINASAN).
SESAN (Secretariat for Food and Nutrition Security) is the core structure of the multisectoral nutrition coordination system in the country, operating under the Guatemala Presidency, which also hosts a committee of all ministers as its decision-making body. SESAN is also in charge of overseeing and coordinating the implementation of the National Food and Nutrition Security Policy 2016-2020.Organisational structure of the Guatemala National System for Food and Nutrition Security (SINASAN)
When NIPN was set up in 2017 it was positioned as a key vehicle to support SESAN in tracking and generating evidence on the implementation of Guatemala’s National Strategy to Prevent Chronic Malnutrition 2016-2020. The Strategy is aligned with the National Food and Nutrition Security Policy but it offers a more in-depth focus on stunting reduction. As such, NIPN strengthens the existing centralised information system, managed by SESAN, which relies on data from the information systems of different key ministries.
Creation and institutionalisation of the Multisectoral Advisory Committee
As the NIPN positioning was clarified, different options for the creation of the Multisectoral Advisory Committee (MAC) were considered during the six-month design phase of NIPN in 2017. The options were based on a thorough review of the national multisectoral coordination structures led by CATIE (Centro Agronómico Tropical de Investigación y Enseñanza), the implementing partner of the NIPN, which included a review of legal documents and interviews with key government and non-government counterparts. Considering the Guatemala specificities, stakeholders agreed that the MAC should support the existing system and thus be part of the existing food and nutrition security coordination structures.
The final decision was to link the MAC to the existing Inter-sectoral Technical Committee (or CTI). The CTI is a technical committee in which all ministries playing a role in food and nutrition security are represented. Though only formed by government representatives, its regulation allows calling upon ad hoc participation of development partners and civil society.
The choice for this option aligns with the core principles of the MAC: it is embedded into multisectoral coordination structures, the structure is formalised to ensure members’ continued participation, and it has the flexibility to invite ad hoc participation of experts outside the government.
In the legal statutes of the existing committee, CTI is allowed to “create any permanent and temporary committees that it deems necessary to fulfil its functions”. When committees are permanent or integrated “their nature, purpose and organisation must be specified, and the financial resources necessary for its operation shall be indicated”. The MAC is registered as a “Working Committee” under the CTI by law, thus ensuring its institutionalisation and sustainability.Role of the MAC
The Multisectoral Advisory Committee’s main role is to “support, orient and provide technical inputs to any of the NIPN work streams aiming at strengthening the Centralised Information System for Food and Nutrition Security to fulfil its mandate of tracking progresses of implementation of the National Strategy to Prevent Chronic Malnutrition and understanding the evolution of chronic malnutrition in a coordinated and comprehension approach.”
Specific roles of the committee include:
- Identifying and formulating policy needs and questions in relation to the progress made in the implementation of the National Strategy to Prevent Chronic Malnutrition;
- Identifying information and data gaps and overcoming bottlenecks in relation to the above, and in particular to problems related to data quality and consistency;
- Supporting the analysis and generation of information to answer the above-mentioned policy needs and questions;
- Mobilising expertise and technical support as required for the implementation of the NIPN operational cycle;
- Supporting the interpretation of existing data and information on nutrition to improve understanding of the determinants of the nutrition situation, both nationally and at sub-national level, with a particular focus on supporting the pilot department and municipalities;
- Formulating key messages and recommendations in order to communicate the findings of the analyses to policy makers;
- Contributing to tracking the progress of stunting prevention at the national, departmental and municipal levels;
- Contributing to the strengthening of national capacity and enhancing the accountability of government and donors to the CTI.
Composition and working modalities at national level
The Committee is multisectoral and multi-stakeholder by nature: it is composed of representatives from the governmental institutions and all ministries who are part of the Food and Nutrition Security System, typically programme officers in charge of planning, monitoring and evaluation. The full Committee is chaired by the Head of the Planning, Monitoring and Evaluation Division of SESAN.
To operate with maximum efficiency, a core group has been constituted from representatives of the four key ministries and institutions responsible for the implementation of the National Strategy to Prevent Chronic Malnutrition: the Ministry of Public Health and Social Assistance; the Ministry of Agriculture, Livestock and Food; the Ministry of Social Development; and the agency in charge of supplying potable water.
The Committee will seek the active contribution and participation of representatives from civil society, the private sector and international development partners, since the law permits civil society and partners’ representation in and contribution to CTI committees.
The CTI not only provides oversight to the MAC but will also present its findings and recommendations to the decision-making committees of all ministers involved in food and nutrition security. Intermediary outputs and findings of the MAC will be shared with other technical coordination fora, such as the SUN platform, and civil society and donors coordination fora.Strengths and challenges
As all stakeholders in Guatemala felt it was crucial to formally embed the MAC in the existing food and nutrition security coordination structures, the first six months of the NIPN implementation phase focused on the institutionalisation process (October 2017 to March 2018). This elaborate process offered the MAC the legitimacy and authority to function effectively. The MAC will use the existing formal communication mechanisms between the technical and decision-making levels to create a data-driven policy dialogue. Though it is too early to have evidence, this set-up maximises the probability of influencing policy decisions and sustaining the policy dialogue beyond the duration of the project.
The current set-up does not come without challenges. The CTI structure is required to comply with government procedures to call upon meetings and thus may lack the flexibility and reactivity to respond in a timely manner to the NIPN’s needs. Mobilising the full committee, with its large number of government representatives, has proven to be challenging up to now. However, the constitution of the core group – with officially appointed representatives from the four key ministries – offers the flexibility to function in an agile and efficient manner. Since December 2018 the core group has met in specific instances including a first workshop to initiate the process of formulating policy questions.The way forward for strengthening the sub-national level
The NIPN platform in Guatemala aims for replication at the sub-national level. SESAN has selected one department to study the cost-efficiency of setting up an NIPN platform at the decentralised level, including a departmental MAC.
-
Setting up a Multisectoral Advisory Committee: an Ethiopia case study
Context
Ethiopia is implementing the second phase of its National Nutrition Programme Phase II (NNP-II) 2016-2020. NNP-II is co-signed by 13 Ministries. It is governed by a multisectoral national coordination structure, consisting of the National Coordination Body at high political and decision-making level, and of the National Nutrition Technical Committee at technical and planning level.
NIPN in Ethiopia is established under the umbrella of the national multisectoral nutrition program and its governance system. It aims to generate knowledge and lessons learned to guide the implementation of NNP-II and support its contributing sectors.
NIPN is hosted by the Ethiopia Public Health Institute (EPHI) who is also the chair of the Monitoring, Evaluation and Research Steering Committee (M&E&R SC), one of the three high level thematic committees of the national multisectoral coordination structure. In addition, due to its multiple responsibilities, EPHI is closely linked to the National Nutrition Technical Committee and the National Nutrition Coordination Body.Multisectoral coordination structure of the National Nutrition Programme (NNP) Phase II (2016-2020)
Creation of the Multisectoral Advisory Committee
During the NIPN design phase, the M&E&R SC was identified as the best placed committee to take up the role of the Multisectoral Advisory Committee to NIPN, because its objectives are so closely aligned with the NIPN objectives. The committee aims to provide technical support and direction, to generate evidence and monitor progress, and to timely inform decision-making for successful implementation of the NNP-II. The members of the M&E&R SC represent all NNP-II signatory government ministries, as well as donors, civil society and research organisations. The SC has most of the MAC attributes: it has included many of the functions for NIPN into its TOR and will play the validation and the communication and dissemination functions; it is ideally placed to be the official relay between the NIPN and the national decision making level. It also presents the advantage of meeting most of the MAC core principles: being part of the existing multisectoral coordination structure overseeing the NNP-II implementation progress; ensuring regular participation of the government representatives of the NNP-II and having the ability to mobilise additional expertise through donors, civil society and research organisations’ participation.
Despite all these advantage, the steering committee has many members. While this steering committee has integrated NIPN advisory roles in its terms of reference, the NIPN also anticipates to create a dedicated NIPN MAC, which will be composed of a small group of selected advisors with high level decision making leverage and with close linkages with ministers. This dedicated MAC will be created in 2019 and it is expected to take up a selected set of NIPN specific activities.
Composition and working modalities at national level
Thus, the MAC follows a dual approach in Ethiopia as it relies on an existing committee, the M&E&R SC and a dedicated NIPN Advisory Committee.
Existing Terms of Reference defined the M&E&R SC membership and operational modalities prior to the NIPN. In addition to those, the M&E&R SC will take up the following MAC tasks:
- Support, advise and coordinate efforts on the development and utilization of a nutrition database under NIPN
- Support the identification of key priority areas for nutrition policy research to better understand the evolution of the national nutrition program and the need for re-direction
- Help to identify key policy questions in line with high level decision makers demand
- Relay and support findings dissemination to high level decision makers, through the national multisectoral coordination (NNCB and NNTC)
- When applicable, actively contribute to the NIPN Capacity Needs Assessment process and be involved in the capacity strengthening efforts launched by NIPN
In the NIPN inception period, the M&E&R Steering Committee has requested the NIPN team to explore further which activities should be carried out to further enhance stunting reduction. As a result, the team has started working on a NIPN demonstration project on WASH and nutrition.
EPHI is the chair of the M&E&R SC, with the Ethiopian Institute of Agricultural Research (EIAR) as co-chair.
Strengths and challenges
The main advantage of embedding some of the functions of the MAC within this existing M&E&R SC lies in the fact that it is already a functioning and credible structure. The Committee’s Terms of Reference are formalized and all committee members have been officially assigned by their respective ministries and are well sensitized with respect to the current nutrition issues in the country and within their respective institutions. The SC is meeting on a regular basis, and many members have direct links to high-level decision makers. It is expected that the multisectoral character of the committee will facilitate data access across sectors, as members have a vested interested in responding to the policy questions taken up by NIPN.
Through its role as chair of the M&E&R SC and its role in the NNCT and the NNCB, EPHI is engaging on a continuous basis with a wide set of multisectoral nutrition stakeholders. It reports on NIPN to the highest nutrition governance structures, allowing for high-level political and decision-making leverage.
Finally, this set-up further promotes the multisectoral implementation of the NNP and facilitates the capacity building approach of NIPN, with motivated members of the M&E&R SC both contributing to the capacity need assessment process, as well as benefiting from the capacity building investments.
However, as the NIPN MAC will be functional only in 2019, it remains to be seen whether it will have the ability to create efficient working relationships with the M&E&R SC to work in complementarity and whether it will acquire the respectability to influence the higher decision making level. -
Capacity development Ethiopia case study
The Ethiopia NIPN country team is adopting a dual approach to building capacity by addressing immediate needs for NIPN specific capacity while developing a long term and systematic capacity strengthening strategy which supports the overall monitoring, evaluation and research agenda of the national nutrition program.
NIPN capacity needs assessment
To develop Ethiopia’s long-term capacity to manage and maintain a NIPN, it is important to identify existing capacities as well as any additional capacities needed to sustain the NIPN approach in the country. A Capacity Needs Assessment (CNA) was launched in 2018 to explore capacity gaps related to evidence based policy making and the monitoring, evaluation and research agenda of the National Nutrition Program (NNP).
This process was initiated by a workshop, facilitated by the International Food Policy Research Institute (IFPRI), which brought together 36 nutrition monitoring and research experts from various sectors and institutions in October 2018. Most of the workshop participants play a role in the National Nutrition Monitoring, Evaluation and Research Steering Committee, which also has an advisory role for NIPN. The aims of the workshop were:- To define a framework for the capacity needs assessment and subsequent strategy related to strengthening the national nutrition monitoring, evaluation, and research agenda, and within it specific needs related to NIPN
- To agree on the current architecture for nutrition related policy processes, monitoring and evaluation and research i.e. assess the capacity of this aspect of the nutrition system in Ethiopia and how NIPN could strengthen it.
Workshop participants developed a framework, which included the ‘demand capacity’ for evidence by the policy makers as well as the ‘supply capacity’ of existing evidence, across three related levels (individual, organizational and systemic). As a result of this workshop an approach paper was developed, which guides the subsequent steps of this multisectoral process.
The next step is the actual assessment of the existing capacities and capacity needs, which was launched in the first trimester of 2019 through an elaborate multi-sectoral and multi-stakeholders participatory process. It included questionnaires, interviews and follow-up consultations with key stakeholders from different ministries, national institutions and universities responsible for collecting and monitoring data for nutrition, and for nutrition-related evaluation and research. Information was sought from over 20 national institutions, in addition to key informant interviews with multisectoral users of these data, including programmatic and policy decision makers.NIPN capacity development strategy
The findings of the capacity need assessment will be used to develop a capacity strengthening strategy, which will be finalized in the second trimester of 2019. In the meantime, action is already underway to address immediate capacity needs within NIPN.
Short-term capacity development
A number of activities were undertaken during the first year of NIPN implementation to address the immediate capacity needs at the individual, organizational and systemic level .These needs were identified through the experiences with the “Learning-by- Doing” demonstration project (see later), rapid capacity needs assessments by direct NIPN stakeholders and were initiated in advance of the NIPN capacity assessment workshop.
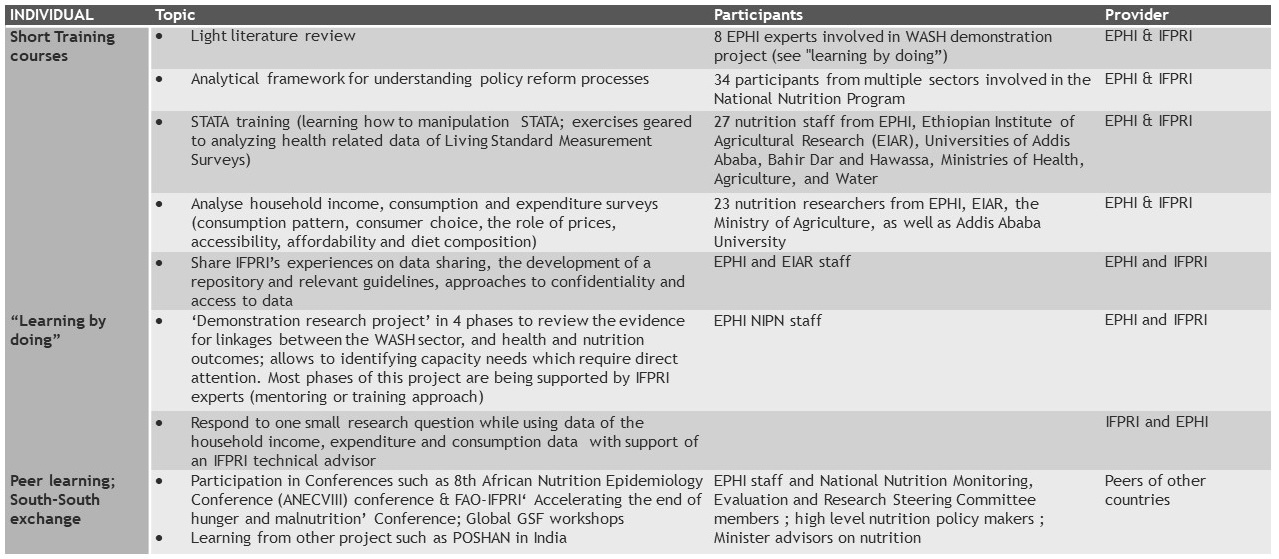
Individual level
Different approaches have been used, including short training courses, ‘learning by doing’ and peer learning. Details of individual capacity development activities undertaken by Ethiopia in 2018 and 2019 are summarized in the table below.
Organisational level
Within EPHI a small, dedicated, team has been assigned to NIPN which collaborates with additional nutrition researchers from EPHI’s Food Science and Nutrition Directorate and other relevant directorates. Their capacity has been strengthened in project management, creating a common understanding of the NIPN approach, analytical and communication capacities and finally creating a better understanding of the different elements of a data repository.
Systemic level
- Research-Policy seminars
EPHI has started organizing regular NIPN Nutrition Research and Policy Seminars. These seminars bring together researchers, program implementers and policy decision makers to discuss and disseminate existing policy-relevant research findings. Participants come from research institutes, universities, non-government organisations and development partners.
- Multi-sectoral involvement
Selected staff of key ministries involved in the National Nutrition Program (NNP) and research institutions that are key for NIPN have been able to access the training opportunities provided under NIPN thus strengthening the long-term capacity of the broader Ethiopian nutrition system and forging partnerships. Members of the Nutrition Monitoring, Evaluation and Research Steering Committee as well as of the Food Based Dietary Guidelines Technical Committee and various universities participated actively in the analytical training.
Long-term capacity development
In parallel to addressing short-term needs, the NIPN aims to address long term capacity requirements to manage and maintain a NIPN. Besides the research policy seminars and the multisectoral engagements, they also include:
PhD training
Long term capacities are being strengthened by involving PhD students from local universities in the formal NIPN training courses. In addition, EPHI has a capacity building budget for staff linked to the NIPN analysis unit or the NIPN advisory committee to attend training (online or formal) in Ethiopia or overseas, which will lead to a certificate, diploma or master’s degree at an overseas university. EPHI can also hire local training institutes and subcontract local universities. There is also a small grant scheme to encourage and support the enrolment of about six staff involved in the NIPN to pursue a PhD programme to sustain capacities beyond the project timeframe. Two researchers have been identified and started their PhD programmes at Addis Ababa University in September 2018.
Mentoring
The Senior Technical and Policy Advisor and the National Research Officer at IFPRI are assigned to support the NIPN full time and they provide continuous support and on the job training for staff and organisations involved in NIPN. In addition, IFPRI provides needs based technical support, which covers a wide set of NIPN skills, including writing, communication and analytical skills. In 2019, a report writing mentor was assigned to provide temporary support to the team. In 2019, IFPRI also assigned a researcher to guide a specific analytical process for further analysis of existing data.
Guidance notes
A set of guidance notes on different aspects of the NIPN approach have been prepared by the NIPN GSF. This guidance aims to facilitate a coherent approach to implementing the NIPN operational cycle. NIPN team members from EPHI as well as from other key partner’s institutions from the national nutrition Monitoring, Evaluation and Research Steering Committee participated in webinars as well as in an on-site country workshop on the content of the guidance notes. The NIPN team in Ethiopia will adapt the guidelines to the local context. The NIPN Global Support Facility (GSF) based in Europe also provides direct technical support to NIPN country teams.
Challenges and opportunities
While embarking into developing the capacity development strategy, the Ethiopia country case shows the importance of focusing on the bigger nutrition governance structure, national policies and programs in order to prevent overlap and ensure a sustainable system which supports the long-term objectives of NIPN:
- Importance to set aside sufficient time which allows for a participatory process. The capacity needs assessment should involve all those who will ultimately be involved in NIPN
- Assess earlier experiences and the existence of capacity needs assessment potentially conducted by partners’ institutions or sectors. Often, sectors or partners have conducted their own assessment already. Thus, it is useful to avoid duplication and focus on the yet ‘uncovered’ or ‘un-addressed’ elements of capacity need assessment.
- In developing the evaluation tools for the actual capacity needs assessment, be mindful about what the objective is and how to formulate the demand on capacity needs. The questionnaire design is an important element of the capacity need assessment as it influences the final output and its scope. Thus, the questionnaire and evaluation tools have to be designed to explore and capture the capacities to be developed as a matter of priority and that will help to unlock potential bottlenecks and bring solutions to the key sectors and partners involved in the national monitoring, evaluation and research agenda in nutrition.
- Be mindful of the selection of the respondents for the capacity need assessment and make sure to involve those linked to the national nutrition program. Where NIPN is supporting a national policy or program, it is important to link this capacity assessment and strategy on the actors involved in monitoring, evaluation, research or policy relevant of this national program.
-
-
-
-
-
NIPN dissemination events Guatemala
NIPN in Guatemala aimed to study progress based on the implementation of three consecutive national multisectoral nutrition strategies, and more specifically with regard to the budget allocation to nutrition over the past 12 years.
The results have been published in a full report and a brief and presented by SESAN (the Secretariat for Food and Nutrition Security) for discussion with national and sub-national government authorities, international cooperation and civil society partners, as well as with Congress.
It is being used to advocate – at the time of the 2019 elections – for better implementation of nutrition actions and, where appropriate, to consider adjustments to implementation or budget allocation. -
Example of question reformulation from the NIPN capacity building workshop in Lao PDR
Topic 1: budget allocation to nutrition interventions for the education sector of the NPAN
ORIGINAL BROAD QUESTION: Is the budget allocation enough for each education intervention?
REFORMULATED BROAD QUESTION: Is the budget allocated to education sector as part of the National Nutrition Strategy equal to what is costed (planned), for each of the planned intervention and how do the provinces prioritize nutrition?
SUB-QUESTIONS:
- How do they prioritize nutrition interventions?
- How many interventions have been implemented with the allocated budget?
REFORMULATION OF SUB-QUESTION 1:
- How does the allocated budget compared to the planned one? What is the gap? What are the trends, by year and by intervention?
- How budget expenditures compare the allocations? By year and intervention of the NPAN? at national and provincial level?
Topic 2: understanding the cultivation of crops of high nutritional value
ORIGINAL BROAD QUESTION: Why does the production of ’nutritious crops’ not increasing?
REFORMULATED BROAD QUESTION: What factors can explain that the production of ’nutritious crops’ are not increasing?
SUB-QUESTION:
- Does the production of ’nutritious crops’ suit with the local conditions?
REFORMULATION OF SUB-QUESTION:
- What proportion of the inputs (seeds, seedling, training to farmers) planned for increasing ‘nutritious crop’ production are reaching the targeted provinces / targeted farmers since the beginning of the strategy?
- What is the proportion of targeted farmers that received the inputs (seeds, seedling, training) did use it to produce ‘nutrition crops’
- What proportion of these farmers producing ‘nutritious crops’ consumed it and what proportion sold it?
- etc.
Topic 3: understanding how vitamin A supplementation achieve its objectives
ORIGINAL BROAD QUESTION: How can we improve the VAS coverage (national baseline being 38%)?
SUB-QUESTIONS:
- What are the differences in VAS among the provinces?
- What is the trends in VAS? Country ? Provinces?
REFORMULATION OF SUB-QUESTION:
- What is the coverage of VAS provided to children 6-59 months delivered through health centers services compared to delivered through campaign, comparing the results in the different provinces?
- What are the trends of VAS for children 6-59 months during the past 10 years comparing each province?
- How are those in relation to the target: how is the annual rate of reduction in each province?
- how are the trends for other selected inputs and activities indicators, comparing a province with high annual rate and low annual rate? (further analysis will need to identify the relevant indicators)
-
Main strengthes and weaknesses of existing data quality assessment tools
WHO DQR integrated into DHIS2 for countries implementing DHIS2 - 2019
Advantages:
- Provides access to facility data recorded in DHIS2 Software
- Can be used to assess quality of indicator of interest available in DHIS2
Disadvantages:
- Does not include examples of nutrition data indicators
- Requires skills to use DHIS2
Advantages:
- Needs to be fed with data to be assessed
Disadvantages:
- Does not include examples of nutrition data indicators
Measure Evaluation DQA Tool - 2008 - Prototol 2: Data Verification
Advantages:
- More suited to evaluation of field supervision data
- Provides recommendations and actions to improve data quality
Disadvantages:
- Does not include examples of nutrition data indicators
- Requires skills to use DHIS2
Measure Evaluation RDQA - 2009 - Checklist to assess program/project data quality
Advantages:
- More suited to evaluation of field supervision data
- Provides recommendations and actions to improve data quality
Disadvantages:
- Does not include examples of nutrition data indicators
- Requires skills to use DHIS2
Measure Evaluation RDQA - 2010 - Checklist to assess program/project data quality
Advantages:
- More suited to evaluation of field supervision data
- Provides recommendations and actions to improve data quality
Disadvantages:
- Does not include examples of nutrition data indicators
- Requires skills to use DHIS2
Measure Evaluation RDQA - 2015
Advantages:
- More suited to evaluation of field supervision data
- Provides recommendations and actions to improve data quality
Disadvantages:
- Does not include examples of nutrition data indicators
- Requires skills to use DHIS2
-
Main characteristics of existing routine data systems
HMIS
- Definition: An information system specially designed to assist in the management and planning of health programmes, as opposed to delivery of care (WHO 1993)
- Advantages: Once it has been set up, it is costs less and allows monitoring of health outcomes and indicators
- Disadvantages: Only captures information for users of the health system and not representative for entire population, denominator need to be estimated for indicator calculation
IDSR
- Definition: Integrated Disease Surveillance programme ensures the availability of guidelines for integrated disease surveillance and response. It provides necessary technical support for strengthening national communicable disease surveillance systems through the implementation of the Regional Strategy for Integrated Disease Surveillance and the International Health Regulations.
- Advantages: useful and relevant in monitoring communicable diseases, it has the advantage to alert about sudden increases of MAM/SAM cases and deaths thus providing alerts in case of context deterioration
- Disadvantages: Not nutrition relevant
Sentinel Surveillance
- Definition: Limited case ascertainment area, traditionally includes largest hospitals in geographic area; Should do pre-evaluation to select appropriate sentinel sites
- Advantages: Can easily collect individual patient-related data; Less costly and burdensome on resources; Flexible system design; Useful for documenting trends; Allows for routine monitoring of antibiotic non-susceptibility
- Disadvantages: Although less costly than population-based surveillance, sentinel system may still require significant financial investments in personnel and resources; Data may provide biased or skewed findings; Data are not generalisable to geographic population; This method does not collect incidence data
Sectors data systems
- Definition: Data routinely collected by sectors based on a set indicators defined to track activities
- Advantages: Source of variety of information (Weather, Climate change, Pollution, Water, sanitation, Education, Food chain, Agriculture data, Budget/finance data, etc.)
- Disadvantages: Aren’t usually well organised and harmonized ones with others in terms of representativeness
*****Sources:
-
i) WHO DQR Data quality domains & metrics or dimension
The WHO DQR propose four data quality domains that categorise the metrics. Some authors call these metrics attributes or dimensions to characterise data. The table below presents the four domains and their metrics of the WHO DQR 2017.
-
ii) Metrics or dimensions not in WHO DQR
The table below presents some metrics included in the Data Quality Assurance Tool of Measure Evaluation (Measure Evaluation: The Data Quality Assurance Tool for Program-Level Indicators, 2007), which are not explicitly included in the WHO DQR.
The use of metrics depends on the objective of the tool and therefore of the assessment. -
iii) Completeness of reporting
The WHO 2017 DQR offers different ways to display reporting completeness at district or national level : either in a table or a graph.
-
iv) Identifying outliers
The identification of outliers is part of the Internal Consistency metric. To compute extreme outliers the tool compares, for a given year, the rate to the median value of the three preceding years. Thus when the value is greater than 3 standard deviations from the mean it is considered as an extreme outlier.
-
v) Consistency over time – constant trend for the indicator
Routine data consistency over time is assessed as part of the Internal Consistency domain. It uses the mean of the three preceding years for the indicator that is compared to the indicator value of the current year.
Use of this feature for nutrition indicators should be carefully studied as countries are currently making efforts to:
- improve coverage of nutrition indicators and this can increase the mean of cases over years;
- invest to prevent and manage malnutrition events which can decrease the number of cases over years and reduce the mean;
- indicators such as wasting can quickly change over time due to shocks or improvement of the situation.
Interpretation of this feature for nutrition indicators (e.g. stunting, wasting or overweight) should be carefully assessed.
-
vi) Consistency over time – increasing trend for the indicator
Routine data consistency over time (Domain 2: Internal consistency of reported data) can be assessed using the DQR. Its uses the mean of the three preceding year for the indicator that is compared to the indicator value of the current year.
-
vii) Internal consistency between related indicators
The tool can be also used to assess consistency between related indicators
Routine data consistency over time (Domain 2: Internal consistency of reported data) can be assessed using the DQR. Its uses the mean of the three preceding years for the indicator that is compared to the indicator value of the current year. -
viii) External comparison of HMIS with survey values
The external consistency of the indicator can be assessed comparing routine data and survey data for the same period of time and geographical level.
-
ix) Quality of population data
To estimate the consistency of population data, it is important to have a good estimation of the denominator used to calculate an indicator from routine data. To assess population data, they are compared to an external source.
The DQR gives an example comparing an estimate of population using government official data with UN estimation.